Direct Detection of Water-dissolved Ammonia Using Paper-based Analytical Devices
This is an Open Access article distributed under the terms of the Creative Commons Attribution Non-Commercial License(https://creativecommons.org/licenses/by-nc/3.0/) which permits unrestricted non-commercial use, distribution, and reproduction in any medium, provided the original work is properly cited.
Abstract
A microfluidic paper-based analytical device (μPAD) is proposed for the selective detection of ammonia in water by using the modified Berthelot reagent and a fluidic channel consisting of hollow paper. The modified Berthelot reagents were uniformly dispersed in cyclohexane and then immobilized in a detection zone of the μPAD. The loading position of the reagents and the type of a sample flow channel were optimized to achieve a sensitive ammonia detection within a short analytical time. The NH3 μPAD exhibits a linear colorimetric response to the concentration of ammonia dissolved in water in the range of 1-100 mg L-1, and its limit-of-detection is 1.75 mg L-1. In addition, the colorimetric response was not influenced by the addition of 100 mg L-1 nitrogen containing compounds (sodium nitrate, sodium nitrite, uric acid, hydroxylamine, butylamine, diethylamine) or inorganic salts (NaCl, Na2HPO4), presenting the enough selectivity in the detection of water-dissolved ammonia against possible interferents.
Keywords:
Colorimetric sensor, Ammonia sensor, Paper-based analytical device, Berthelot reagent1. INTRODUCTION
Ammonia is one of the most harmful contaminants in the aquatic ecosystem due to its high toxicity [1–4] and great solubility in water [5]. Moreover, ammonia, being a nitrogen-containing nutrient compound, causes eutrophication and algal boom [5]. This molecule is widely produced in chemical factories, naturally formed from various refuse, and then dissolves into effluents such as domestic sewage, agricultural and industrial wastewater. Therefore, an easy and cost-effective ammonia detection method is greatly demanded in order to manage the environmental risk associated due to the presence of ammonia in surface water and groundwater.
Several types of analytical techniques have been developed and are now available to determine the concentration of ammonia in water samples, including potentiometry [6], titrimetric analysis, colorimetry [7], and spectrophotometry [8,9]. However, most of them have been limited for on-site use due to their non-portability, difficulty in operating expensive instruments, and delicate pretreatment of analytical samples. Colorimetric ammonia detection based on ammonia-selective chemical reactions is a promising method. There are two representative approaches proposed by Nessler and Berthelot. The Nessler method is based on the reaction of mercury (II) iodide and potassium iodide with ammonia in a highly alkaline environment to form a yellow-colored complex [9]. On the other hand, the Berthelot method, also known as the indophenol reaction, relies on the formation of a greenish-blue product (indophenol) formed from the chemical reaction between ammonia and detection reagents such as phenol, hypochlorite and catalyst in strongly alkaline conditions [10–13]. Due to the toxicity of phenol and the instability of hypochlorite, these chemicals are alternated with sodium salicylate [9–12] and sodium dichloroisocyanurate [10], which together form a solution known as a modified Berthelot reagent. These two methods generally have a quite good selectivity and sensitivity to ammonia. However, the Berthelot reagent is more frequently used because it provides better visibility in color change and is less toxic than the Nessler one. Since phenol and hypochlorite can react in absence of ammonia, they must be isolated prior to the addition of ammonia analyte for the Berthelot’s detection reaction. The side reactions occur between the sodium salicylate and the sodium dichloroisocyanurate present in the modified Berthelot reagent.
Microfluidic paper-based analytical devices (μPADs) were introduced by Martinez et al. [14] as a new methodology for low-cost qualitative and quantitative analysis. The main mechanism of μPADs is the spontaneous transport of a liquid along a paper channel made of hydrophilic cellulose microfibers. The characteristics of μPADs are lower costs, higher portability, and easier manipulation and storage with respect to other analytical devices. Colorimetric detection is frequently utilized in μPADs because the white paper detection zone of μPADs provides high contrast while the colorimetric reaction is taking place. The analytical method using the μPAD can be easily upgraded to quantify multiple analytes at the same time. The μPAD detection for multiple analytes is usually possible by the distribution of an aqueous sample into several detection zones through the hydrophilic flow pathways which share one inlet, and the quantitative analysis is performed by analyzing the colorimetric responses of each detection zones of μPAD [13,14].
A few colorimetric ammonia μPADs have been previously reported in the literature. Nxumalo et al. fabricated an ammonia-sensing PAD using a pre-mixed Nessler reagent [15]. Thongkam et al. reported a simple paper-based ammonia sensor based on the indophenol blue method, which is fabricated by stacking two paper layers modified with sodium salicylate and sodium dichloroisocyanurate, respectively [16]. Jayawardane et al. introduced a gas-diffusion μPAD for ammonia determination in wastewater samples. This μPAD can detect ammonia gas evaporated from the liquid sample using a pH indicator [17]. Lau et al. developed a solid-state ammonia sensor using the modified Berthelot reagent mixed with microcrystalline cellulose in toluene [18].
Here, we propose a new colorimetric μPAD for selective and irreversible detection of ammonia via the formation of the indophenol from the modified Berthelot reagent. Unlike other research based on the Berthelot reaction, the modified Berthelot reagent’s components are immobilized together on the detection zone of the ammonia μPAD without being separated. All detection reagents are homogeneously dispersed in cyclohexane and then uniformly loaded on the detection zone without any side reaction occurring before the addition of ammonia. The determination of ammonia concentration in water is attained through the following steps: transport of an aqueous sample through the paper channel, colorimetric reactions between ammonia and the modified Berthelot reagent in a detection zone, and final quantification of its color change. The μPAD is fabricated to have a multilayer three-dimensional structure is optimized to attain a fast sample delivery and efficient ammonia detection. The layered structure is realized by attaching pre-prepared layers using a simple lamination machine.
2. EXPERIMENTAL
2.1 Chemicals and materials
Sodium salicylate (NaSC), sodium dichloroisocyanurate (NaDIC), sodium nitroprusside (Na2NP), lithium hydroxide (LiOH), cyclohexane, sodium phosphate monobasic (Na2HPO4), butylamine, uric acid and hydroxylamine hydrochloride (NH2OH-HCl) were purchased from Sigma-Aldrich. Aqueous ammonia solution (28 wt%) was obtained from Junsei Chemical. Ethanol (99%), sodium chloride (NaCl), sodium nitrate (NaNO3) and sodium nitrite (NaNO2) were bought from Daejung Chemicals and Metals (South Korea). Diethylamine was purchased from Samchun chemical (South Korea). Chromatography paper (Chr 1, Whatman), a transparent polyethylene terephthalate (PET) film (t = 190 μm, SKC, South Korea), transparent acryl plate (t = 500 μm) and a lamination film (t = 150 μm, Hands Korea) were used to fabricate the sensor.
2.2 Preparation of the modified Berthelot reagent
Compounds of the modified Berthelot reagent (NaSC, NaDIC, Na2NP and LiOH) were individually ground by a ball mill machine (pulverisette 23, FRITSCH). The milling speed was 30 times sec-1 and the total milling time was 30 min. After the milling, all the chemicals were added and dispersed in a liquid solvent (water, ethanol or cyclohexane) by a bar-type sonication machine (VCX 130, Sonics). The concentrations of the reagents were typically controlled to be [NaSC] = 25 mmol L-1, [NaDIC] = 25 mmol L-1, [Na2NP] = 0.34 mmol L-1, and [LiOH] = 40 mmol L-1. The optimized concentrations were established through ammonia-detecting experiments at various concentrations of Na2NP and NaDIC. The modified Berthelot reagent was homogenously dispersed in the solvent using ultrasonic agitation for 5 min.
2.3 Fabrication of NH3 PAD
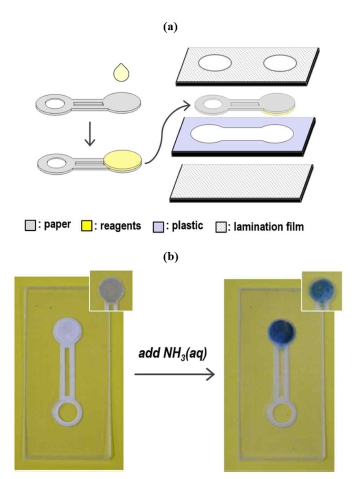
A laser machine (VLS 2.30, Universal) was utilized to cut sheet materials such as paper, a PET film, an acryl plate and a lamination film for the fabrication of the μPADs. The cutting shapes were created by CorelDraw software. The modified Berthelot reagent was positioned on the detection zone of μPADs by drop-casting 30 μL of the dispersion using a micropipette and then dried under ambient conditions. After the immobilization of the detection reagent, a paper layer with the detection zone was aligned with other layers (see Fig. 1a) and then attached by laminating them at 130℃ using a commercial lamination machine. After the lamination process, the μPAD was further pressed for a tight bonding using a press machine at a pressure of 30 MPa for 1 min. In the fabricated μPAD, the detection zone modified with the modified Berthelot reagent was positioned face downwards. When adding an aqueous solution of ammonia into an inlet, the solution is spontaneously transported to the detection zone, and, once reached, results in a blue coloration of the zone, due to the formation of indophenol (see Fig. 1b).
2.4 Colorimetric ammonia detection
The initial color of the fabricated μPAD was recorded by a flatbed scanner (Scanjet G3110, HP) prior to the addition of a sample, in order to evaluate its color change. Standard NH3 samples in concentrations of 1, 10, 50, 75 and 100 mg L-1 were prepared using deionized water. These samples were supplied to an inlet of the PADs. The colorimetric response was typically quantified with a detection time of 15 min. The color information of the scanned image was acquired by ImageJ software, and the color change was expressed with a grayscale magnitude in R coordinate in the RGB color space. Actually, the NH3 concentration was found to correlate with the inverse of the R component in the grayscale.
For the evaluation of detection selectivity, additional analyte solutions in a concentration of 100 mg L-1 were prepared from sodium nitrate, sodium nitrite, uric acid, sodium chloride, sodium phosphate monobasic, hydroxylamine, butylamine or diethylamine. The analyte concentrations of these solutions were controlled to be identical to the ammonia concentration of 100 mg L-1. The detection selectivity was evaluated based on the colorimetric responses for the individual analytes of ammonia and the interfering molecules. The cross-selectivity was quantified with samples with two analytes (ammonia and one interferent). A sample volume of 105 μL was used for these experiments. The same image acquisition and color analysis, mentioned above, were utilized to quantify the colorimetric responses.
3. RESULTS AND DISCUSSION
3.1 Optimization of the detection zone
The NH3 detection zone of μPAD was treated with the dispersions prepared in different solvents with the aim to find an effective fabrication process. The modified Berthelot reagent’s compounds are dissolved in water, ethanol and cyclohexane. Dispersions prepared in ethanol and cyclohexane were opaque because the solubility was too low and the required amount of reagent was too high to be dissolved. The dispersions were diluted to examine whether the color-changing side reactions with the modified Berthelot reagent occur in the solution. Fig. 2a shows pictures taken from the three different dispersions diluted in each solvent: water, ethanol and cyclohexane. The water sample exhibits transparency and light-yellow color, different from ethanol and cyclohexane, which show white opaque coloring. The yellowish color can be addressed due to the occurrence of side chemical reactions between NaSC and NaDIC in water, which is confirmed by the UV-visible spectra of the three solutions, shown in Fig. 2b. Unlike the aqueous solution which has a maximum absorbance at 400 nm, the spectra of ethanol and the cyclohexane dispersions exhibit a gradual decrease in absorbance, as a result of the light scattering of small-sized particles present in the solutions. For the same reagents’ concentration, the absorbance of the cyclohexane dispersion is found to be greatly higher over the full visible wavelength range than that of the ethanol dispersion, which suggests a partial dissolution of the reagents in ethanol. The cyclohexane dispersion showed an identical absorption spectrum when the dispersion was measured after 1 h, which indicates that the modified Berthelot reagent was stable in cyclohexane. The dispersions prepared in different solvents (water, ethanol, and cyclohexane) were used to fabricate PADs to test the colorimetric response of the modified Berthelot reagent in an aqueous ammonia sample. Fig. 2c shows images of these PADs scanned by the flatbed scanner, for 10 min after the supply of ammonia analyte in a concentration of 100 mg L-1. The PAD using cyclohexane dispersion exhibits a much stronger greenish-blue color than those prepared using water or ethanol solvents, which indicates more favorable conditions for the formation of indophenol. In the case of using the water dispersion, the PAD reveals a weak yellow color, suggesting the occurrence of a side reaction with the modified Berthelot reagent. These results indicate that nonpolar cyclohexane is the best solvent among the other chemicals tested to be used for the fabrication of PADs.
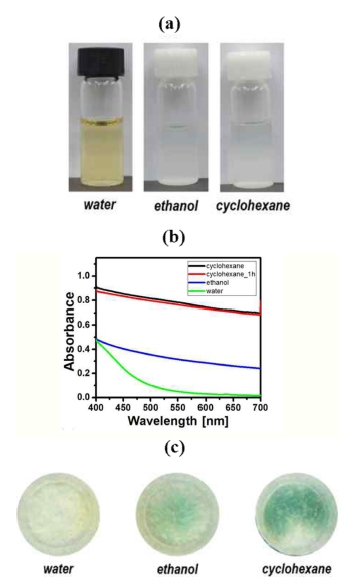
(a) Pictures of the dispersions prepared in water, ethanol and cyclohexane, (b) UV-visible absorbance spectra of the dispersions, and (c) color-changing images, which is prepared by the flatbed scanner, of the detection zones fabricated using the three dispersions.
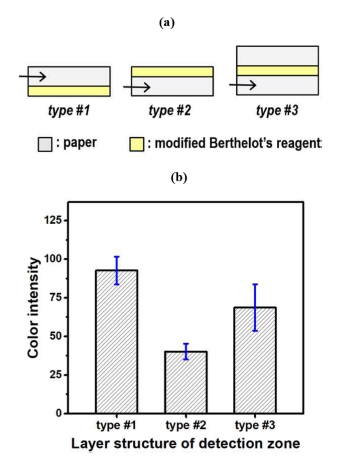
The detection zone of an ammonia PAD is arranged in a multi-layer structure in order to optimize the colorimetric response. Fig. 3a shows schematic diagrams of the cross-sectional layer structures of three tested detection zones. The detection reagent is located at the bottom and top of the paper layer in types #1 and #2, respectively. In type #3, the reagent-coated top surface is additionally covered with a plane paper because the reagent layer exhibited a yellowish color. The three different types of PADs were fabricated and their colorimetric responses were evaluated for the ammonia analyte in a 100 mg L-1 concentration. Fig. 3b shows a bar plot of the response magnitude for the three types. Type #1 device exhibits the highest intensity in greenish-blue, i.e., due to the favorable formation of indophenol. Therefore, the device structure of type #1 is chosen to prepare a highly sensitive μPAD for ammonia detection.
3.2 Optimization of a fluidic channel for an efficient flow
Various device structures are fabricated were evaluated to find an optimized μPAD for sensitive, and reliable ammonia detection. The μPADs were prepared in order to have three different flow channel shapes in the proximity to the detection zone, as shown in Fig. 4a. In type #1, the detection zone is directly connected to the paper layer, which acts as a flow channel. Devices of type #2 and type #3 have two paper bridges with a width of 1 mm and a hollow gap between the detection zone and the paper channel. These two devices differ in the angle between the two bridges and in the gap distance: type #2 shows a bridge angle of 180° and a gap distance of 0.5 mm, while type #3 has an angle of 120° and a gap of 1.0 mm. All the types have an air-opened paper area with the same diameter dimension of 5.0 mm for the observation of colorimetric response. μPADs were fabricated to have the three different device types and their detection performances were evaluated using a sample with 100 mg L-1 NH3(aq). Fig. 4a shows images, which were scanned by the flatbed scanner, of the detection zones for the three μPADs after the ammonia assay. All detection zones similarly display a greenish-blue color. Fig. 4b shows a bar plot of the colorimetric response intensity for the three devices (number of samples = 6). Devices with the paper bridge (type #2 and type #3) exhibited stronger color intensity with respect to that of type #1. Furthermore, the response deviation of type #3 resulted to be smaller than that of type #2, indicating that type #3 has better coloration reproducibility.
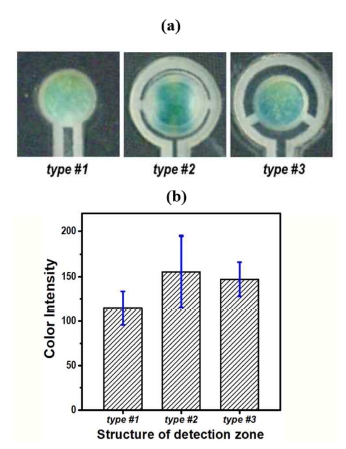
(a) Pictures of three different μPADs having different detection zone shapes, and (b) a bar plot of the colorimetric response for the three devices.
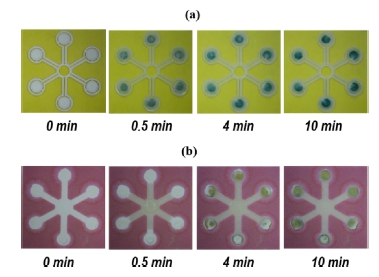
Structures of the flow channel were also studied for the NH3 PAD. In conventional PADs, an intact hydrophilic paper is used as a pathway of an aqueous sample; whereas, our μPADs utilize a partially hollow paper channel enclosed in polymer sheets at the top and bottom side for the transport of the water sample. Fig. 5a shows several pictures of the hollow paper channel, taken at different times after the supply of 100 mg L-1 NH3(aq). In this PAD, the ammonia sample is distributed and delivered to six detection zones for the multiplexed ammonia analysis. At a detection time of 0.5 min, almost all of the sample is transported to the detection zone and an initial coloration to greenish-blue can be observed. The coloration becomes more obvious after 4 min when the color intensity reaches 90% of the saturated value. The color saturation is observed after 10 min. Fig. 5b shows several pictures of the conventional μPAD with six detection zones, taken at the same detection times as the hollow μPAD. At a detection time of 0.5 min, the sample is starting to reach the entrance region of each detection zones. During the detection period of 4–10 min, the coloration is observed and its response intensity is gradually intensified. The resultant color intensity at 10 min is much weaker than that of the hollow μPAD. As a result, the μPAD with the hollow flow channel results not only in the fastest detection difference but also in the strong colorimetric response when compared with conventional μPAD with a simple paper channel. These observations indicate that the colorimetric detection characteristics strongly depend on the flow channel structure. The higher color intensity is to be mainly addressed to the fast detection time since ammonia is likely to evaporate quickly. Ammonia is known to have Henry’s constant of 0.0167 atm M-1[19]. Since the upper side of the conventional μPAD is open to the air, a significant amount of ammonia is expected to evaporate during long detection times. However, the μPAD with the hollow channel has a shorter detection time and a closed device structure, which results in a minimization of ammonia evaporation. These results clearly reveal the advantages of the μPAD with the hollow channel in colorimetric ammonia detection. In this work, the μPAD with six detection elements is mainly used to determine ammonia content in water samples.
3.3 Detection characteristics of ammonia in water
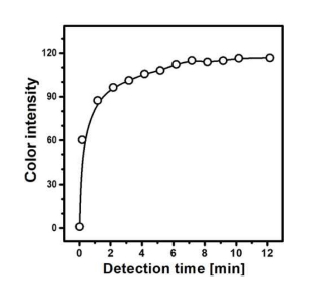
A detection time was investigated using the optimized μPAD with an immobilized detection zone using the modified Berthelot reagent. Fig. 6 shows the variation of a colorimetric response as a function of the elapsed time after adding an NH3 solution to the inlet of PAD. Color intensity rapidly increases until becomes saturated and reaches a maximum value. This result reveals that the formation of a colored indophenol product to an extent of 90% saturation is possible within a reaction time of 4 min. The prompt increase at nearly 0 min indicates that the transport of the aqueous solution through the hollow channel was fast. A color difference between a dry and wet state is observed.
The colorimetric ammonia detection was carried out using the multiplex μPAD with six detection zones in the concentration range of 0–100 mg L-1, as shown in Fig. 7a. The detection zone gradually changed in color, from yellowish-green to greenish-blue with an increasing concentration of NH3. The circled symbols in Fig. 7b are the average colorimetric responses obtained from six sensing elements. The dashed line, determined by the linear regression, corresponds to the standard curve between NH3 concentration and color intensity, which has a linear equation of y = 0.671x + 63.6 (R2 = 0.9989). A correlation coefficient with a value very close to 1.0 implies that the standard curve has excellent linearity in the concentration range of 0–100 mg L-1. Furthermore, the limit-of-detection (LOD) was found to be 1.75 mg L-1 at which the colorimetric response became three times higher than the standard deviation of the blank. This LOD value is sufficiently lower to evaluate the quality of groundwater and wastewater. It is worth mentioning that the blank (DI water) produces a perceptible response in yellowish-green (color intensity ~ 60). The background color change is due to the formation of colored byproducts in an aqueous solution of the modified Berthelot reagents, as mentioned above. The NH3- sensing properties of our μPAD are summarized and compared with previously reported ammonia sensors and PADs in Table 1. Interestingly, our μPAD exhibits a wider linear range than other counterparts, which provides an advantage in the quantitative determination of NH3 concentration. In addition, our PAD reveals better detection performances in terms of LOD and detection time with respect to the simple solid-state sensor; while the sensing properties are slightly inferior or equal to the sophisticated multi-layer and gas-diffusion μPADs. Lastly, our one-layer device structure can easily attain multiplex PADs to detect multiple analytes simultaneously.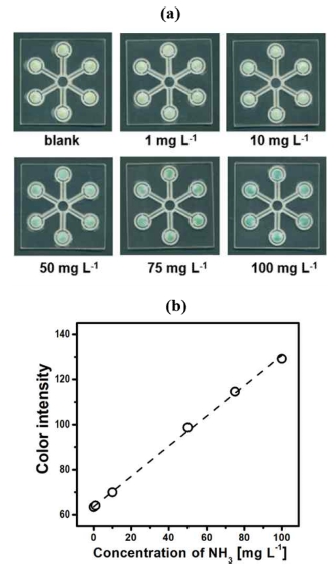
(a) Scanned images of the μPADs for aqueous ammonia solutions with the different concentrations, and (b) a plot of colorimetric response versus NH3 concentration.
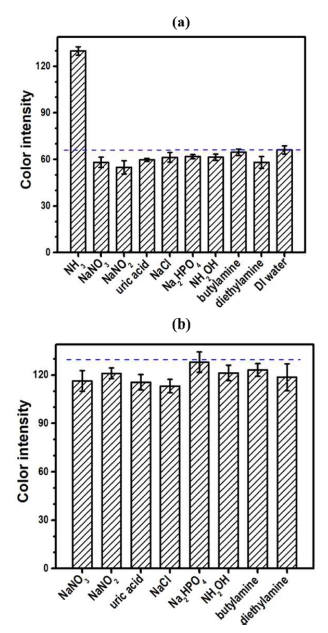
Selective detection of ammonia analyte was evaluated using potential interfering molecules such as NaNO3, NaNO2, NaCl, Na2HPO4, uric acid, hydroxylamine, butylamine, and diethylamine. Fig. 8a shows the variation of the colorimetric response with respect to a single interferent with a concentration of 100 mg L-1, ammonia, and DI water. The response magnitude to NH3 analyte is approximately two times greater than those to other interferents, revealing a good detection selectivity of NH3. When compared with the blank sample (DI water), the interfering molecules exhibit a small reduction in color intensity. These results suggest that the colorimetric response to the interfering molecule mainly results from the formation of the yellowish-green byproducts formed from the chemical reactions between a water solvent and the modified Berthelot reagent. In addition, the interferents seem to slightly suppress the formation of chromophore products, probably due to the changes in pH and solubility of the detection reagents. The cross-selectivity experiments were performed using an aqueous sample containing both ammonia and one kind of interferent. Fig. 8b shows a bar plot of color intensity versus the additional interferent, with the dashed line corresponding to the reference response of the standard ammonia solution in a concentration of 100 mg L-1. With the presence of additional interferent, a slight decrease in color intensity is observed at the same ammonia concentration. An average reduction of 7.9% was found among the interferents tested. These results suggest that our one-layer PAD can be applied to real aqueous samples, such as domestic and industrial wastewaters, for determining an ammonia concentration higher than 10 mg L-1.
4. CONCLUSIONS
This work presents a new μPAD for facile and selective ammonia assay in water samples, using the modified Berthelot reagent and hollow paper channels. The modified Berthelot reagent is found to maintain its chemical reactivity for ammonia when the chemicals are dispersed in cyclohexane and then transported to the detection zone. The NH3 μPAD is fabricated by using simple cutting and lamination processes. The optimized device structure of μPAD was explored to attain a sensitive and selective ammonia detection within a short analysis time. The optimized μPAD has a colorimetric response which is proportional to the concentration of ammonia in water and in the range of 1–100 mg L-1 with an LOD of 1.75 mg L-1.
Acknowledgments
This work was supported by the GRRC program of Gyeonggi province [GRRC-HY2020-B04, Development of hydrogen sensing and monitoring technology for safety.
References
-
R. Braun, P. Huber, and J. Meyrath, “Ammonia toxicity in liquid piggery manure digestion”, Biotechnol. Lett., Vol. 3, No. 4, pp. 159-164, 1981.
[https://doi.org/10.1007/BF00239655]

-
V. Walker, “Ammonia toxicity and its prevention in inherited defects of the urea cycle”, Diabetes Obes. Metab., Vol. 11, No. 9, pp. 823-835, 2009.
[https://doi.org/10.1111/j.1463-1326.2009.01054.x]

-
R. V. Thurston, R. C. Russo, and G. A. Vinogradov, “Ammonia toxicity to fishes. Effect of pH on the toxicity of the unionized ammonia species”, Enrion. Sci. Technol., Vol. 15, No. 7, pp. 837-840, 1981.
[https://doi.org/10.1021/es00089a012]

-
J. E. Ryer-Powder, “Health Effects of Ammonia”, Plant/Oper. Prog., Vol. 10, No. 4, pp. 228-232, 1991.
[https://doi.org/10.1002/prsb.720100411]

-
N. F. Y. Tam and Y. S. Wong, “Effect of ammonia concentrations on growth of Chlorella vulgaris and nitrogen removal from media”, Biosesour. Technol., Vol. 57, No. 1, pp. 45-50, 1996.
[https://doi.org/10.1016/0960-8524(96)00045-4]

-
S. Alegret, J. Alonso, J. Bartroli, and E. Martinez-Fàbregas, “Flow Injection System for On-line Potentiometric Monitoring of Ammonia in Freshwater Streams”, Analyst, Vol. 114, No. 11, pp. 1443-1447, 1989.
[https://doi.org/10.1039/AN9891401443]

-
A. Amirjani and D. H. Fatmehsari, “Colorimetric detection of ammonia using smartphones based on localized surface plasmon resonance of silver nanoparticles”, Talanta, Vol. 176, pp. 242-246, 2018.
[https://doi.org/10.1016/j.talanta.2017.08.022]

-
F. J. Krug, J, Růžička and E. H. Hansen, “Determination of Ammonia in Low Concentrations with Nessler’s Reagent by Flow Injection Analysis”, Analyst, Vol. 104, No. 1234, pp. 47-54, 1979.
[https://doi.org/10.1039/an9790400047]

-
R. T. Emmet, “Spectrophotometric determination of urea and ammonia in natural waters with hypochlorite and phenol”, Anal. Chem., Vol. 41, No. 12, pp. 1648-1652, 1969.
[https://doi.org/10.1021/ac60281a007]

-
M. D. Krom, “Spectrometric determination of ammonia: a study of a modified Berthelot reaction using salicylate and dichloroisocyanurate”, Analyst, Vo. 105, No. 1249, pp. 305-316, 1980.
[https://doi.org/10.1039/an9800500305]

-
H. Verdouw, C. J. A. Van Echteld, and E. M. J. Dekkers, “Ammonia determination based on indophenol formation with sodium salicylate”, Water Res., Vol. 12, No. 6, pp. 399-402, 1978.
[https://doi.org/10.1016/0043-1354(78)90107-0]

-
C. E. Bower and T. Holm-Hansen, “A salicylate-Hypochlorite Method for Determining Ammonia in Seawater”, Can. J. Fish. Aquat., Vol. 37, No. 5, pp. 794-798, 1980.
[https://doi.org/10.1139/f80-106]

-
M. M. Mentele, J. Cunningham, K Koehler, J. Volckens and C. S. Henry, “Microfluidic paper-based analytical device for particulate metals”, Anal. Chem., Vol, 84, No. 10, pp. 4474-4480, 2012.
[https://doi.org/10.1021/ac300309c]

-
A. W. Martinez, S. T. Phillips, M. J. Butte, and G. W. Whitesides, “Patterned paper as a platform for inexpensive, low-volume, portable bioassays”, Angew. Chem. Int. Ed., Vol. 46, No. 8, pp. 1318-1320, 2007.
[https://doi.org/10.1002/anie.200603817]

-
N. L. Nxumalo, L. M. Madikizela, H. G Kruger, S. C. Onwubu, and P. S. Mdluli, “Development of a paper-based microfluidic device for the quantification of ammonia in industrial wastewater”, Water SA, Vol. 46, No. 3, pp. 506-513, 2020.
[https://doi.org/10.17159/wsa/2020.v46.i3.8661]

-
T. Thongkam, R. Rungsirisakun and K. Hemavibool, “A simple paper-based analytical device using UV resin screen-printing for the determination of ammonium in soil”, Anal. Methods, Vol. 12, No. 38, pp. 4649-4656, 2020.
[https://doi.org/10.1039/D0AY01180K]

-
B. M. Jayawardane, I. D. McKelvie, and S. D. Kolev, “Development of a gas-diffusion microfluidic paper-based analytical device (μPAD) for the determination of ammonia in wastewater samples”, Anal. Chem., Vol. 87, No. 9, pp. 4621−4626, 2015.
[https://doi.org/10.1021/acs.analchem.5b00125]

-
K. T. Lau, S. Edwards, and D. Diamond, “Solid-state ammonia sensor based on Berthelot’s reaction”, Sens. Actuators B Chem., Vol. 98, No.1, pp. 12-17, 2004.
[https://doi.org/10.1016/j.snb.2003.08.004]

-
R. Sander, “Compilation of Henry’s law constants (version 4.0) for water as solvent”, Atmos. Chem. Phys., Vol. 15, No. 8, pp. 4399-4981, 2015.
[https://doi.org/10.5194/acp-15-4399-2015]

