Electrochemical Monitoring of NADH Redox with NPQD-modified Electrodes for Cell Viability Assessment
This is an Open Access article distributed under the terms of the Creative Commons Attribution Non-Commercial License(https://creativecommons.org/licenses/by-nc/3.0/) which permits unrestricted non-commercial use, distribution, and reproduction in any medium, provided the original work is properly cited.
Abstract
There is increasing interest in the rapid and highly sensitive monitoring of cell viability in biological and toxicological research. Conventional methods depend on optical assays using Water Soluble Tetrazolium-8 (WST-8) or 3-(4,5-dimethylthiazolyl-2)-2,5-diphenyltetrazolium bromide (MTT) assay, which requires a large volume of samples and special instruments, necessitating shipment of clinical samples to laboratories. This paper reports on the development of a rapid and sensitive electrochemical (EC) sensor using screen printed electrode (SPE) and surface modification using 4’-mercapto-N-phenylquinone diamine (4’-NPQD), as double electron mediators, for monitoring cell viability via the measurement of nicotinamide adenine dinucleotide (NADH). We used the sensor to observe the viability of MCF-7 and doxorubicin (Dox)-treated cells. The oxidation current of NADH was measured via chronoamperometry (CA), and the EC results showed a good linear relationship when compared with NADH quantification using WST-8 assay. The analysis time was only 10 s and limit of detection (LOD) of NADH was 1.78 μM. Our EC method has the potential to replace conventional WST assays for cell viability and cytotoxicity experiments.
Keywords:
Nicotinamide adenine dinucleotide (NADH), Chronoamperometry (CA), Screen printed electrode (SPE), Doxorubicin (Dox), Surface modification1. INTRODUCTION
Nicotinamide adenine dinucleotide (NADH) is a well-known coenzyme involved in mitochondrial function [1,2]. NADH is a vitamin B3 derivative with antioxidant properties that holds various functions in the human body. NADH deficiency causes energy production problems and induces Parkinson’s disease due to the lack of adenosine triphosphate (ATP) [3-5].
NADH acts as an enzymatic mediator in several electrochemical (EC) mechanisms via oxidation/reduction to form NAD+ or NADH. In cells, NADH reduces flavin adenine dinucleotide (FAD), a component of the electron transport chain that is essential for generating ATP [6,7]. During these metabolic reactions, electrons and protons are transferred between NADH and its substrate. Typically, NADH undergoes oxidation during this process; NAD+ and its two electrons are lost, and the substrate is reduced [9,10]. The conventional method for measuring NADH levels involves an optical assay using Water Soluble Tetrazolium-8 (WST-8) or 3-(4,5-dimethylthiazolyl-2)-2,5-diphenyltetrazolium bromide (MTT). These chemicals are easily reduced by NAD(P)H to produce a formazan product, which can be determined by monitoring the absorbance in the range of 430–550nm. The absorbance of formazan is proportional to the NAD(P)H concentration [11]. Although the conventional method is simple and attractive, its applications remain limited. They require an optical device that occupies a large space and has a high cost per test [12].
The EC biosensor is an advanced analytical tool for NADH detection because of its high sensitivity and ultralow limit of detection (LOD) at a low cost, and it has numerous advantages when compared to other analytical methods [13]. However, it requires a high potential for the direct detection of NADH oxidation as high as 1.0 V [14,15]. Additionally, NAD+ oxidized form easily adsorbed onto the electrode, leading to reduced sensitivity due to electrode fouling. To overcome these limitations, diimine functional groups have been adopted because diimines catalyze the oxidation of NADH at low potential [16].
In this study, we developed an EC sensor using a surface-modified screen-printed electrode (SPE) to quantify NADH in cell culture medium. As an electrocatalyst, 4’-mercapto-N-phenylquinone diimine (4’-NPQD) was immobilized on the Au region of the SPE to decrease the redox potential of the NADH/NAD+ couple. The EC sensor requires only 50 μL of sample per analysis and completes amperometric measurements within 10 s. This SPE permits simple, rapid, cheap, and fast EC analysis in microliter volumes. We systematically performed NADH quantification, and the sensor showed a 1.78 μM LOD and a sensitivity of 0.00495±0.00018 μM/μA. Additionally, the EC results were compared with those of the conventional WST-8 assay, and the results showed a good linear relationship when compared with NADH quantification using the WST-8 assay. Finally, their cytotoxicity was assessed using doxorubicin (Dox)-treated MCF-7 cells. The proposed EC sensor may be applicable in the field of toxicology and has the potential to replace conventional WST assays.
2. EXPERIMENTAL
2.1 Materials
A premixed WST-8 cell proliferation assay kit was purchased from Takara Bio, Inc. (Kusatsu, Japan). RPMI 1640 medium and penicillin-streptomycin were purchased from Life Technologies (Carlsbad, CA, USA). Potassium ferricyanide [K3Fe(CN)6], 4-aminothiophenol (4-ATP), 100 and 10 mM Dulbecco’s phosphate-buffered saline (DPBS), Tween 20, and absolute ethanol, Dox (D515) were purchased from Sigma-Aldrich (St. Louis, MO, USA) and used without further purification. All the reagents used in this study were of analytical grade.
2.2. Apparatus and electrode
Commercial SPE (Model No: DRP C220 AT, Φ = 4 mm), including an Au working electrode (WE) with a surface area of 12.56 mm2 was purchased from Metrohm DropSens Co. (Oviedo, Spain). This electrode included an Au counter electrode (CE) and silver pseudo-reference electrode (RE). Chronoamperometry (CA), cyclic voltammetry (CV), and EC impedance spectroscopy (EIS) were performed using a multichannel potentiostat (BioLogic Co., Seyssinet, France). All the EC measurements were conducted at room temperature in a Faraday cage.
2.3 Surface modification of SPE
Before surface modification, EC cleaning was performed using H2SO4. To be more specific, 50 μL drop of a 10-mM H2SO4 was dropped on the SPE, and CV was performed from 0 V to 1.8 V at a scan rate of 100 mV/s to remove the dust. The SPE system was then washed with DI water and dried with nitrogen. After drying in a stream of nitrogen gas (N2), we prepared a self-assembled monolayer (SAM) of 4-ATP on the SPE. This was achieved by incubating the electrode overnight at 4 oC in a solution of 10 mM 4-ATP dissolved in absolute ethanol, following the method described by the Takeo group [16]. The SPE was then washed with absolute ethanol for 1 min and again with 0.05 % Tween 20 in 10 mM DPBS (pH 7.2) to remove the remaining chemicals. Furthermore, 4’-NPQD layer was generated on the Au electrode by a double step EC surface modification. 1) 50 μL of 100 mM DPBS (pH 7.2) was dropped on the SPE, and CV was performed by applying a potential between 0.8 V and –0.4 V for 20 times. After washing the electrode with 10 mM DPBS (pH 7.2), the CV step was the same as that used in the previous step and was performed again by changing 100-mM DPBS to 10-mM DPBS. After the surface modification, the electrodes were washed with 0.05 % Tween 20 in 10-mM DPBS and stored in 10-mM DPBS.
2.4 Cell culture and WST-8 Viability assay
The MCF-7 cells were cultured and maintained according to standard cell culture protocols. The culture medium was Dulbecco modified eagle medium (DMEM) supplemented with 10 % fetal bovine serum (FBS) (Welgene, S101-01) and 1 % penicillin-streptomycin (Welgene, LS202-02). The cells were incubated in a humidified atmosphere containing 5 % CO2 at 37 oC. Upon reaching confluence, cells were trypsinized using 0.25 % trypsin and 0.05 % EDTA (Welgene, LS015-10) for 3 min, followed by centrifugation to concentrate the cells. Cells were seeded at a density of 10,000 cells/well in a 96-well plate and treated with Dox hydrochloride. The WST-8 cell viability assay kit (Biomax, QM1000) was added to the medium, and the cells were incubated at 37 oC for 30 min. Absorbance was measured at 450 nm using a microplate reader (Biotek, Synergy HT).
2.5 EC measurement of NADH in cell supernatants
To quantify the NADH in the cell culture supernatants, 50 μL of the extracted supernatant, as described in the previous section, was added dropwise to the 4’-NPQD modified electrode. NADH was quantified within 10 min of extraction to prevent contamination. Three replicates were used at each concentration; non-treated and Dox-treated cells were used as the positive control and media (no cells) were used as the negative control. NADH levels were quantified using CA. We applied a potential of 0.7 V and recorded the current after 10 s, when it achieved a stable state.
2.6. Methods in statistics
All assays were run three times to check reproducibility, and the mean value and standard deviation were calculated for each concentration to generate the calibration curve. Each replicate was analyzed using a new SPE system. NADH standard sample in the medium was prepared at each time point to maintain fresh conditions. Nonlinear curve fitting was performed using origin 8.0.
3. RESULTS AND DISCUSSIONS
A schematic representation of NADH analysis using EC and optical methods is shown in Fig. 1. MTT and WST assays are widely used to assess cell viability via NADH detection. The MCF-7 cells were seeded in 96 well plates and incubated. Additionally, the cells were treated with Dox. After the cells were incubated for 24 h to observe the effect of Dox treatment time, the supernatant was collected. A collected sample was used for EC analysis to determine whether our EC sensor could detect NADH and monitor mitochondrial dysfunction in a cell culture system. To monitor NADH, the substance 4’-NPQD was immobilized on the SPE via EC functionalization due to 4’-NPQD’s good redox behavior and rigid structure. As previously mentioned, 4’-NPQD lowers the oxidized potential of NADH and it leads to high reproducibility and sensitive NADH quantification.
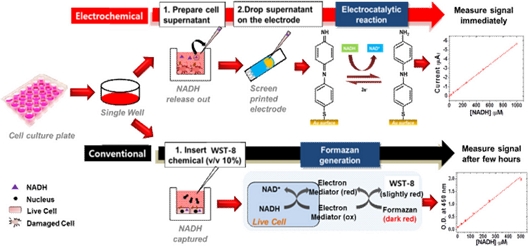
Schematic illustration of the electrocatalytic NADH measurement assay. Red: Electrocatalytic assay based on EC method; black: conventional WST-8 or MTT assay based on optical method.
The NPQD layer was constructed via EC functionalization of 4-ATP, which was immobilized by covalent bonding, as first developed by the Takeo group [16]. First, 4-ATP was immobilized on the electrode by covalent bonding between Au material and thiol interaction ((1)→(2)). After 4-ATP immobilization, 4’-NPQD was generated with a similar process but a different EC functionalization method to improve the performance ((2)→(3)) (Fig. 2(a)). Fig. 2(b) shows the impedance change obtained via EIS during the generation of each monolayer. We employed EIS to investigate the characteristics of bare, 4-ATP, and 4'-NPQD modified gold (Au) surfaces in a constant concentration of redox species Fe(CN)63-/4-. We observed a significant increase in charge transfer resistance (Rct) upon forming the 4'-NPQD layer, rising from 1.24 kΩ to 2.98 kΩ. This increase is attributed to the carbon chain in dibenzene, which forms a denser and thicker layer, providing greater electrical insulation. Consequently, the charge transfer resistance (Rct) increased, leading to a decrease in current.
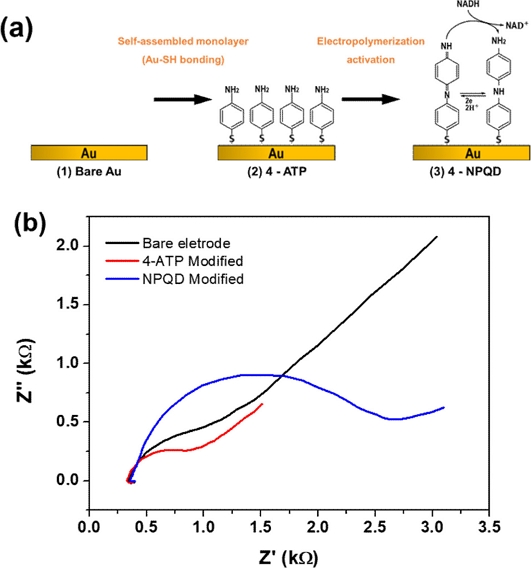
(a) EC functionalization of 4’-NPQD modified Au electrode. (b) EIS data of each electrode; black line (bare Au), red line (4-ATP modified), and blue line (4’-NPQD modified).
As previously mentioned, 4’-NPQD layer was generated with an EC functionalization using 4-ATP modified electrode. The EC transformation of 4-ATP in a neutral solution forms a dimer and a redox-activated surface as NPQD. Aminothiophenol molecules interact with nearby aminothiophenol molecules and head-to-tail coupling occurs. Finally, they become dimers to form NPQD [16].
Fig. 3(a) shows the CV data obtained during the EC functionalization of 4-ATP in 100-mM DPBS at pH 7.4. The large anodic and cathodic peaks near 0.65 V smoothly decreased using a CV cycle. This result differs slightly from previous reports because the cathodic current at 0.55 V and anodic current at −0.2 V decreased. The reversible redox peak at 0.23 V emerged through a repeating CV cycle. However, the redox peak at 0.23 V was not observed, and we speculated that this was due to differences in our proposed system. The SPE comprised Au working, Au counter, and silver (Ag) reference electrodes; and 4-ATP was immobilized on the working and counter electrodes. To increase the stability of the sensor, we chose a double-step functionalization to generate the NPQD layer. This indicated that the same preparation step was performed using 10 mM DPBS (Fig. 3(b)). Furthermore, 4’-NPQD layer, which is generated via double-step, maintains rigid and stable structure after oxidizing NADH [12].
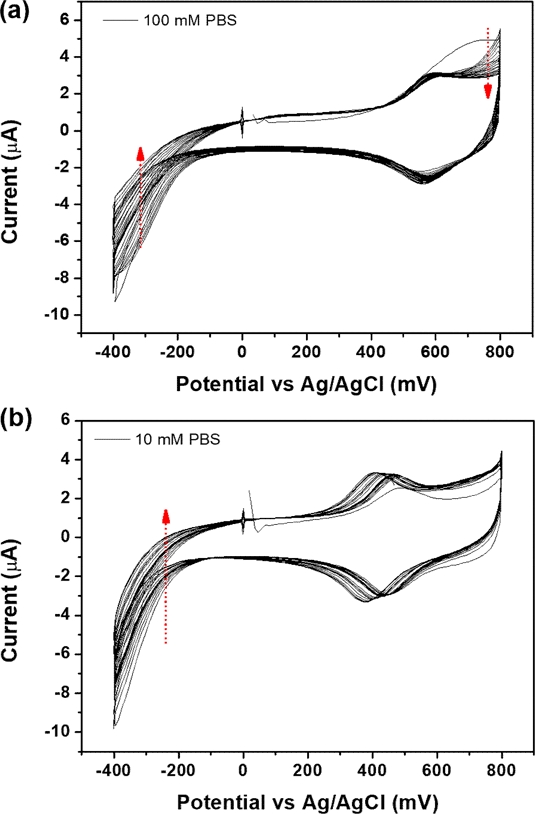
(a) CV data during EC functionalization of the 4-ATP modified electrode in 100-mM DPBS (pH 7.4) and (b) in 10-mM DPBS (pH 7.4).
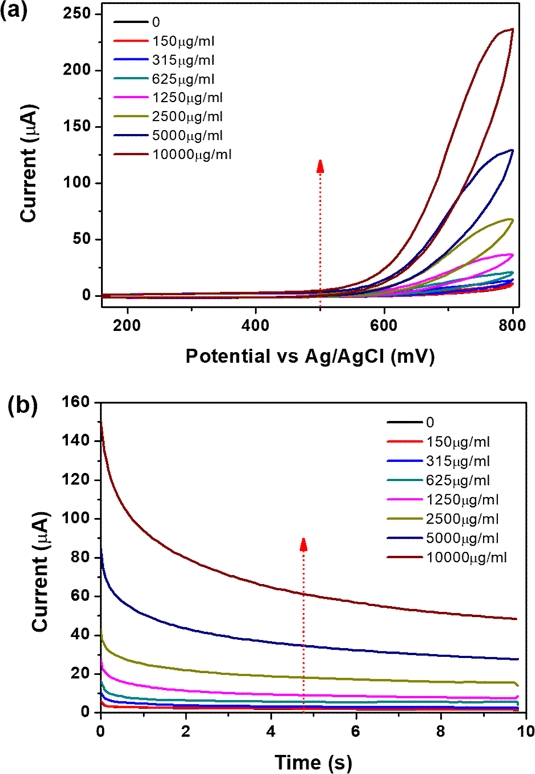
After characterization of the surface-modified electrode, we observed the electrocatalytic performance of the NPQD-modified SPE in a cell culture medium. As previously mentioned, quantifying NADH in the cell is important because NADH is a cofactor for investigating mitochondrial dysfunction. The current is caused by the oxidation of NADH to NAD+, which regenerates the diamine, as shown Fig. 1. The current remains unchanged with an increasing NADH concentration from −100 to 400 mV. However, the current increases as the NADH concentration increases from 500 to 800 mV (Fig. 4(a)). This implies that to oxidize NADH to NAD+, a potential of over 400 mV is required as the driving force. We fixed the potential at 700 mV because the current changed considerably with respect to NADH concentration (Fig. 4(b)). The CA curve at 700 mV was used to construct a calibration plot of NADH because of the short and fixed potential analysis time (10 s) when compared to that of the CV measurement.
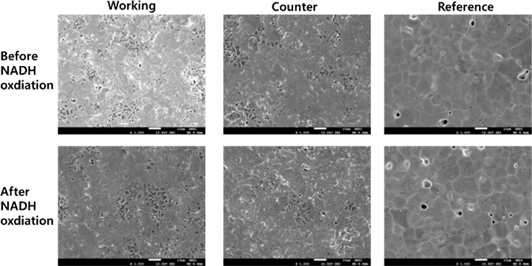
As previously mentioned, one of the disadvantages of the EC NADH sensor is the electrode fouling effect because it requires a high potential to oxidize NADH. However, 4'-NPQD layers produced using our double-step method resulted in a lower NADH oxidation potential. Consequently, this approach yields higher reproducibility and sensitivity when compared to other EC sensors. SEM images were acquired to examine the electrode surfaces. As depicted in Fig. 5, the working, counter, and reference regions of the electrode post-NADH measurement exhibited similarities to their state prior to the NADH measurement.
Finally, the concentration of NADH in the medium was determined according to equation (1), exhibiting a linear range of 16–10,000 μM and a LOD of 1.64 μM, as shown in Fig. 6(a). Standard NADH samples were prepared by spiking NADH into DMEM medium in concentrations ranging from 1 μM to 10,000 μM. To validate the effectiveness of NADH monitoring, the oxidized current of NADH was measured via amperometry. This measurement was then correlated with the O.D. value to establish a standard curve, as illustrated in Fig. 6(b). The correlation between current and O.D. value was estimated to be 2.71 O.D./μA, with a linearity constant of 0.992 (n=3). The LOD in terms of O.D. unit was calculated to be 0.21.
| (1) |
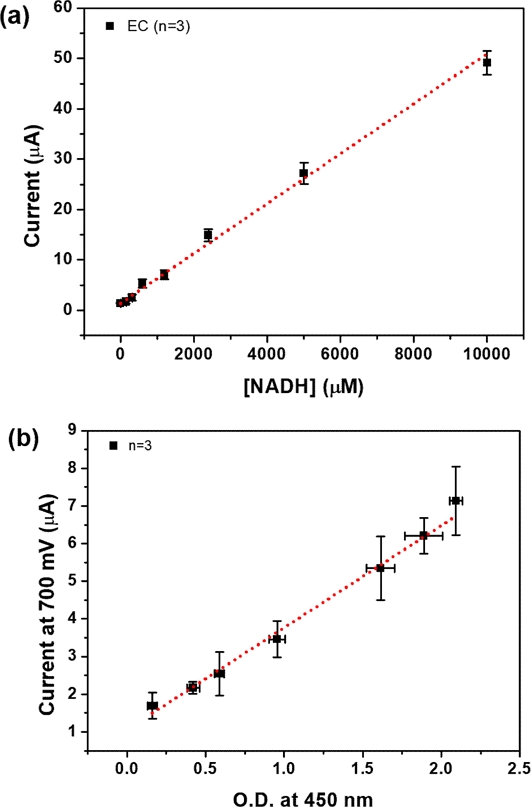
(a) Calibration plot of EC NADH measurements (n=3). (b) Correlation curve for NADH in medium samples. An amperometric signal was obtained at a potential of 700 mV versus Ag/AgCl, and Optical density (O.D.) was measured at a wavelength of 450 nm with a reference wavelength of 650 nm (n=3).
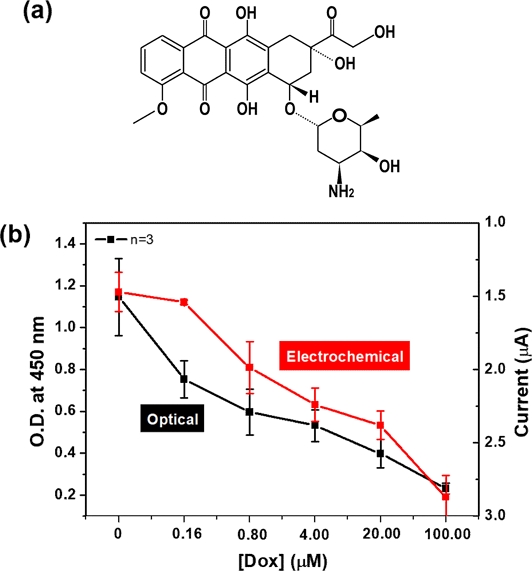
To test the feasibility of the EC monitoring of NADH, we performed a cell viability assay after exposure to 100, 20, 4, 0.80, 0.16 μM Dox. Specifically, Dox is involved in the induction of DNA damage, inhibition of cell proliferation, mitochondrial impairment, and cell death (Fig. 7(a)). As shown in Fig. 7(b), the obtained EC value was similar to that obtained by the WST-8 assay, even though the two assays, used to quantify NADH, were different. As expected, cell viability decreased with increasing Dox concentration. Our results show that the EC sensor for monitoring NADH has the potential to replace the conventional cell viability assay with high sensitivity and short analysis time.
4. CONCLUSIONS
In this study, we demonstrated that the 4’-NPQD modified SPE enables detection of NADH at low concentrations in cell culture medium and can be applied to cell viability. This sensor exhibits many advantages over conventional methods of detection: it does not require chemicals; analysis time is short; it does not require costly equipment, such as a plate reader; and it requires only a minimal sample (50 μL). These findings underscore the potential of EC sensors as powerful tools for the monitoring and quantification of NADH.
Acknowledgments
This research was supported by Kumoh National Institute of Technology(2022~2023).
REFERENCES
-
R. D. Evans and L. C. Heather, “Human metabolism: pathways and clinical aspects”, Surgery (Oxford), Vol. 40, No. 2, pp. 219-226, 2022.
[https://doi.org/10.1016/j.mpsur.2022.01.004]

- K. N. Frayn, Metabolic regulation: a human perspective, Oxford, John Wiley and Sons, UK, pp. 27-130, 2009.
-
B. Pelzmann, S. Hallström, P. Schaffer, P. Lang, K. Nadlinger, G. D. Birkmayer, K. Vrecko, G. Reibnegger, and B. Koidl, “NADH supplementation decreases pinacidil-primed IK(ATP) in ventricular cardiomyocytes by increasing intracellular ATP”, Br. J. Pharmacol., Vol. 139, No. 4, pp. 749-754, 2003.
[https://doi.org/10.1038/sj.bjp.0705300]

-
G. J. Stienen, J. L. Kiers, R. Bottinelli, and C. Reggiani, “Myofibrillar ATPase activity in skinned human skeletal muscle fibres: Fibre type and temperature dependence”, J. Physiol., Vol. 493, No. 2, pp. 299-307, 1996.
[https://doi.org/10.1113/jphysiol.1996.sp021384]

-
C. H. Barlow and B. Chance, “Ischemic areas in perfused rat hearts: Measurement by NADH fluorescence photography”, Science, Vol. 193, No. 4256, pp. 909-910, 1976.
[https://doi.org/10.1126/science.181843]

-
J. D. Enderle, “Biochemical Reactions and Enzyme Kinetics,” in Introduction to biomedical engineering, J. D. Enderle and J. D. Bronzino, Eds. Elsevier, Amsterdam, pp. 447-508, 2012.
[https://doi.org/10.1016/B978-0-12-374979-6.00008-3]

-
A. S. Bommarius and B. R. Riebel-Bommarius, Biocatalysis: fundamentals and applications, Oxford, John Wiley and Sons, UK, pp. 43-61, 2004.
[https://doi.org/10.1002/3527602364]

-
S. Immanuel and R. Sivasubramanian, “Electrochemical studies of NADH oxidation on chemically reduced graphene oxide nanosheets modified glassy carbon electrode”, Mat Chem Phys, Vol. 249, p. 123015, 2020.
[https://doi.org/10.1016/j.matchemphys.2020.123015]

-
S. Immanuel, R. Sivasubramanian, “Electrochemical reduction of NAD+ on graphene oxide and chemically reduced graphene oxide nanosheets”, Mat. Sci. Eng. B, Vol. 262, p. 114705, 2020.
[https://doi.org/10.1016/j.mseb.2020.114705]

-
R. Ciriminna and M. Pagliaro, “Green chemistry in the fine chemicals and pharmaceutical industries”, Org. Process. Res. Dev., Vol. 17, No. 12, pp. 1479-1484, 2013.
[https://doi.org/10.1021/op400258a]

-
K. Chamchoy, D. Pakotiprapha, P. Pumirat, U. Leartsakulpanich, and U. Boonyuen, “Application of WST-8 based colorimetric NAD (P) H detection for quantitative dehydrogenase assays”, BMC Biochem., Vol. 20, No. 4, pp. 1-14, 2019.
[https://doi.org/10.1186/s12858-019-0108-1]

-
J. K. Lee, H. N. Suh, S. H. Yoon, K. H. Lee, S. Y. Ahn, H. J. Kim, and S. H. Kim, “Non-destructive monitoring via electrochemical NADH detection in murine cells”, Biosensors, Vol. 12, No. 2, p. 107, 2022.
[https://doi.org/10.3390/bios12020107]

-
J. Lee, C. T. Bubar, H. G. Moon, J. Kim, A. Busnaina, H. Lee, and S. J. Shefelbine, “Measuring bone biomarker alkaline phosphatase with wafer-scale nanowell array electrodes”, ACS Sens., Vol. 3, No. 12, pp. 2709-2715, 2018.
[https://doi.org/10.1021/acssensors.8b01298]

-
A. Kitani, Y. H. So, and L. L. Miller, “Electrochemical study of the kinetics of NADH being oxidized by diimines derived from diaminobenzenes and diaminopyrimidines”, J. Am. Chem. Soc., Vol. 103, No. 25, pp. 7636-7641, 1981.
[https://doi.org/10.1021/ja00415a036]

-
J. Moiroux and P. J. Elving, “Effects of adsorption, electrode material, and operational variables on the oxidation of dihydronicotinamide adenine dinucleotide at carbon electrodes”, Anal. Chem., Vol. 50, No. 8, pp. 1056-1062, 1978.
[https://doi.org/10.1021/ac50030a015]

-
C. R. Raj and T. Ohsaka, “Electrocatalytic sensing of NADH at an in situ functionalized self-assembled monolayer on gold electrode”, Electrochem. Commun., Vol. 3, No. 11, pp. 633-638, 2001.
[https://doi.org/10.1016/S1388-2481(01)00239-9]

