계단형 양자우물 구조가 적용된 센서 광원 용 발광다이오드 소자
This is an Open Access article distributed under the terms of the Creative Commons Attribution Non-Commercial License(https://creativecommons.org/licenses/by-nc/3.0/) which permits unrestricted non-commercial use, distribution, and reproduction in any medium, provided the original work is properly cited.
Abstract
Electrical and optical characteristics of the GaN-based light-emitting diode (LED) with the improved multi-quantum well (MQW) structure have been studied for light source in bio-sensing systems. Novel GaN/In0.1GaN/In0.2GaN/In0.1GaN/GaN and Al0.1GaN/GaN/In0.2GaN/GaN/Al0.1GaN (MQW) structures were suggested, and their radiative recombination rate, light output power, electroluminescence, and external quantum efficiency were compared with those of the conventional GaN/In0.2GaN/GaN MQW structure using device simulation. The LED with the GaN/In0.1GaN/In0.2GaN/In0.1GaN/GaN MQW structure showed an excellent recombination rate of 5.57 × 1028 cm-3·s-1 that was more than one order improvement over that of the conventional LED. In addition, the efficiency droop was relieved by the suggested stepped MQW structure.
Keywords:
Light emitting diode, Multi-quantum well, GaN, Light source1. 서 론
최근 바이오센서는 나노기술, 생명기술 및 전기화학의 비약적인 발달로 의료와 제약뿐만 아니라 식품 안전, 환경, 보안과 같은 다양한 응용분야에서 사용되고 있어 연구가 활발히 진행 중이다 [1]. 바이오센서는 화학 또는 생화학 물질을 실시간으로 검출 및 측정하는 분석 장치로, 생물학적 반응을 광학적, 기계적 및 전기화학적 방식으로 사람이 인식할 수 있는 신호로 변환하여 특정 물질을 분석할 수 있다 [2]. 일반적으로 바이오센서의 광원은 빛을 조사하여 입사광의 표면 굴절률 변화를 통해 물질의 농도 및 상호 작용을 감지하는데 사용되거나, 바이오 물질의 생물학적 반응과 상호 작용을 발생시키는데 사용된다 [3,4]. 바이오 센서의 광원으로 사용되는 종류에는 백열등(Incandescent Lamp), 수은 램프(Mercury Lamp), 레이저 다이오드 (Laser Diode), 발광 다이오드(Light-emitting diode, LED) 등이 있다 [5]. 그 중에서도 빠른 응답속도, 낮은 전력 소모, 긴 수명과 소형화가 가능한 발광다이오드가 바이오센서 광원으로 주로 사용되고 있다 [6,7]. 또한 넓은 에너지 밴드갭(bandgap)으로 인해 자외선 및 청색 발광이 가능하고, 낮은 전력 손실과 고효율 발광의 장점을 지닌 GaN 기반의 LED를 사용한 바이오센서는 LED의 빛이 특정 항원-항체 반응을 감지하는 과정의 광원으로 바이오 의학 분야에서 활용할 수 있다 [8]. 이렇듯 최근에는 바이오센서 기기의 광원으로서 다양한 응용이 가능한 LED를 사용하여 바이오센서를 개발하는 데 많은 연구가 진행되고 있다.
센서의 광원으로 사용되는 AlGaN, GaN, InGaN 등의 GaN 계열 물질 기반 LED는 극소량의 탐지물질 감지를 위한 보다 강한 광원의 효율적 작동이 요구된다. 대부분의 질화물(nitride) 기반 LED는 발광효율의 증대를 위하여 다중양자우물(multi-quantum well, MQW) 층을 포함하며, 우물층(quantum well layer)으로 상대적으로 밴드갭이 작은 InGaN, 장벽층(quantum barrier layer)으로 밴드갭이 큰 GaN을 사용한다. 대표적 III-V족 질화물반도체인 넓은 띠 간격(wide bandgap) GaN 기반 LED는 우물층의 GaN 내 Al 또는 In의 조성에 따라 1.9 eV에서 6.2 eV 파장의 녹색, 청색, 자외선 영역의 발광이 가능하다 [9-13]. 일반적으로 InGaN 우물층을 포함하는 LED의 발광효율은 낮은 전류 영역에서 최대치를 나타내며, 주입하는 전류가 증가함에 따라 점진적으로 감소하는 문제점을 보인다. 이러한 현상은 효율드룹(efficiency droop)이라 불리며, 이는 고출력, 고효율 GaN 계열 기반 LED의 잠재적 응용 범위를 크게 줄인다 [14-17]. 최근 효율드룹 현상의 원인으로 GaN와 InGaN 계면에서의 분극현상(polarization effect) 및 압전효과(piezoelectric effect)에 의한 누설전류 발생 [18], 우물층 내 오거 재결합(Auger recombination) [19], 고전류 주입에 따른 접합가열 (junction heating) [20], InGaN층 내 불균일한 In 분포에 의한 캐리어 비편재화 [21] 등의 메커니즘이 제안되었다.
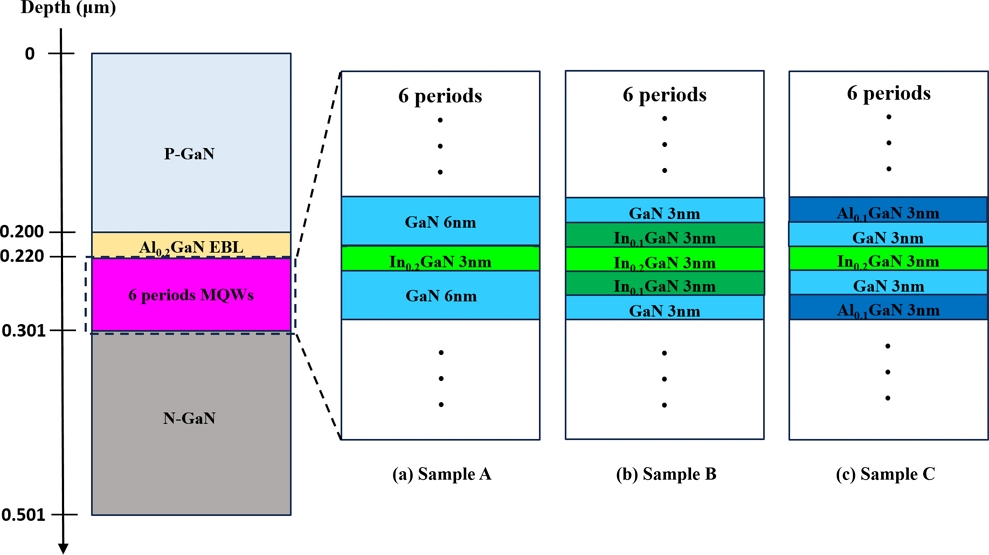
일반적으로 GaN 기반 LED에는 효율적인 전자와 전공의 발광 재결합(radiative recombination)을 위하여 InGaN를 우물층, GaN를 장벽층으로 하는 GaN/InGaN/GaN 구조의 양자우물구조가 적용된다. 일반적인 양자우물구조에 단일 GaN 장벽층 대신, In0.1GaN/GaN 또는 GaN/Al0.1GaN 계단형 장벽층을 사용할 경우, 더 많은 전자, 전공의 캐리어 구속이 가능하다 [22]. 즉, GaN/In0.2GaN/GaN 양자우물 구조 대신 GaN/In0.1GaN/In0.2GaN/In0.1GaN/GaN 또는 Al0.1GaN/GaN/In0.1GaN/GaN/Al0.1GaN의 양자우물구조를 적용할 경우, In0.2GaN 우물층으로부터의 In 확산을 최소화하여 양자우물구조의 결정품질(crystal quality)을 향상시키고, 편광효과(polarization effect)를 낮추고, 내부 양자 효율(internal quantum efficiency, IQE)을 증가시켜, 단일 GaN 장벽층 적용 대비 낮은 전력에서 고출력 발광을 일으킬 수 있을 것으로 예상된다. 본 연구에서는 센서용 LED 광원소자의 양자 효율을 향상을 위한 새로운 장벽층 구조가 제시되고 분석되었다. 기존의 (1) GaN/In0.2GaN /GaN 양자우물구조와 새로운 (2) GaN/In0.1GaN/ In0.2GaN/In0.1GaN/GaN 양자우물구조와 (3) Al0.1GaN/GaN/In0.1GaN/GaN/Al0.1GaN 양자우물구조가 설계됐으며, 3가지의 양자우물구조를 갖는 LED의 전류-전압, 광출력-전압, 광출력-전류, 재결합율 (recombination rate), 전기장 발광(electroluminescence), 광효율 등의 LED 특성이 소자 시뮬레이션을 통하여 비교되고 연구되었다.
2. 연구 방법
Fig. 1은 양자우물구조 비교분석을 위한 소자모사에 사용된 기존의 LED 구조 (Sample A)와 새롭게 제시된 구조 (Sample B, Sample C)를 나타낸다. Sample A는 GaN/In0.2GaN/GaN, Sample B는 GaN/In0.1GaN/In0.2GaN /In0.1GaN/GaN, Sample C는 Al0.1GaN/GaN/In0.1GaN /GaN/Al0.1GaN을 각각 양자 우물 구조로 갖는다. 위에서 제시한 모든 Sample에 대한 양자 우물 구조가 6주기 반복되어 총 81 nm의 두께를 갖는 다중 양자 우물 구조가 적용되었다. 발광층은 인듐 함량이 20%인 In0.2GaN으로 구성되었고, 두께는 3 nm이다. 장벽층은 Sample A는 GaN 6 nm, Sample B는 GaN 3 nm와 인듐 함량이 10%인 In0.1GaN 3 nm, Sample C는 GaN 3 nm와 알루미늄 함량이 10%인 Al0.1GaN 3 nm로 구성되어 있다. 다중 양자 우물층을 제외하고는 Sample A, B, C 모두 공통적으로 200 nm의 p형 GaN 층, 20 nm의 알루미늄 함량이 20%인 Al0.2GaN EBL(electron blocking layer)층, 200 nm의 n형 GaN 층을 적용하였다. P형 GaN 층과 Al0.2GaN EBL층에는 p형 정공 농도가 각각 2.5×1018 cm−3, 1.0×1018 cm−3 농도로 도핑되었으며, 다중 양자 우물층과 n형 GaN 층은 UID(unintentionally doping)을 고려하여 n형 전자농도가 각각 5.0×1016 cm−3, 5.0×1018 cm−3 농도로 도핑되었다. Silvaco사의 Atlas TM 프로그램을 사용하여 소자 시뮬레이션이 진행되었다. 페르미-디락 통계(Fermi-Dirac statistics), 연속방정식 (continuity equation), 푸아송 방정식(Poisson’s equation)을 이용한 광발광(optical generation), 쇼클리-리드-홀 재결합 (Shockely –Read-Hall recombination), 오거 재결합, 자발적 및 압전 분극 (spontaneous and piezoelectric polarization), 표류-확산 이동(drift-diffusion transport) 관련 모델이 적용되었으며, 소자 시뮬레이션을 위한 물질 변수는 문헌값 및 시뮬레이션 프로그램 데이터베이스 값을 적용하였다 [23].
3. 결과 및 고찰
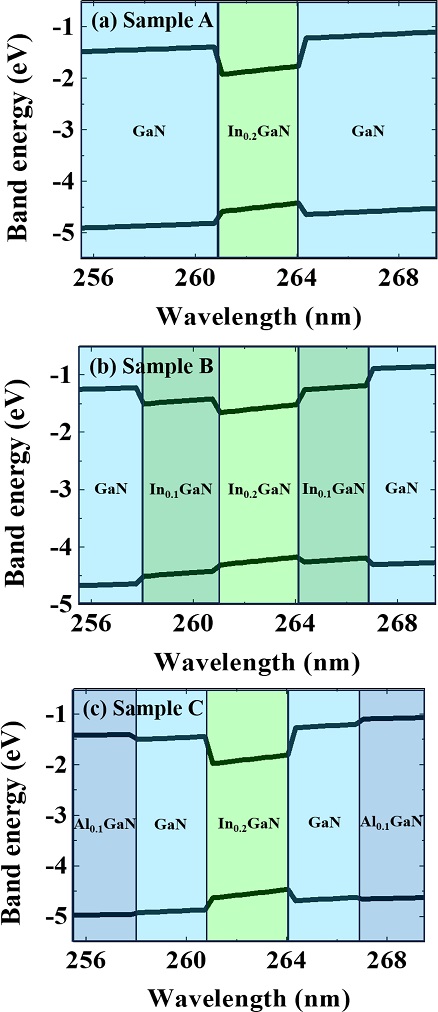
Fig. 2 (a), (b), (c)는 Sample A, B, C의 6주기 다중 양자 우물(MQWs)층에서의 한 주기에 해당하는 에너지밴드 그림(energy band diagram)를 나타낸다. Sample B는 기존의 Sample A 대비 장벽층 GaN과 우물층 In0.2GaN 사이에 분극 현상(polarization effect)을 완화시키기 위한 완충장벽층 In0.1GaN을 포함한다. Sample C는 기존의 Sample A 대비 GaN 장벽층에 에너지 밴드갭이 더 큰 Al0.1GaN 장벽층을 포함하며, 누설전류에 의한 효율저하를 방지하기 위한 목적이다. Sample A, B, C 모두 우물층으로 3 nm의 In0.2GaN가 사용되었으며, 한 쪽 장벽층의 두께는 6 nm로 동일하다.
Fig. 3 (a)는 Sample A, B, C에 대한 다중양자우물 구조에서 5 V 전압 인가 시 수직 깊이에 따른 전자 농도를 나타낸다. Fig. 3 (b), (c), (d)는 Sample A, B, C 각각의 5V 전압 인가 시, 다중 양자우물 내에 위치에 따른 전자 농도를 보여준다. Sample A는 1.90×1019 cm−3의 최대전자농도를 나타내는 반면, Sample B는 2.74×1019 cm−3, Sample C는 1.98×1019 cm−3의 최대 전자농도를 각각 나타낸다. Fig. 3 (C)에서 Sample B는 보다 고른 영역의 양자우물에서 전체적으로 높은 전자농도를 나타냄을 알 수 있다. Fig. 4 (a)는 다중양자우물에서의 5 V 전압 인가 시 수직 깊이에 따른 정공 농도를 나타낸다. Fig. 4 (b), (c), (d)는 Sample A, B, C 각각의 5 V 전압 인가 시, 다중양자우물 내 위치에 따른 정공 농도를 보여준다. Sample A는 8.65×1018 cm−3, Sample C는 1.01×1019 cm−3의 최대 정공 농도를 갖는 반면에 Sample B는 2.30×1019 cm−3의 최대 정공 농도를 갖는다. Fig. 3, 4를 통해서 알 수 있듯이 전체적으로 다중 양자우물층에서 Sample B의 전자와 정공 농도가 가장 높음을 알 수 있다. 이와 같이 GaN/In0.1GaN/In0.2GaN/In0.1GaN/GaN 양자우물 구조를 갖는 Sample B에서 가장 높은 전자, 전공의 캐리어 농도를 가지는 현상은 분극 현상의 완화에 있다. Sample B는 장벽층 GaN와 우물층 In0.2GaN 사이에 분극 현상을 완화시키기 위한 In0.1GaN 완충 장벽층을 보유함으로써 분극 현상에 의한 캐리어 구속 약화를 방지할 수 있다. 분극 현상은 전자와 전공 함수의 중첩영역을 감소시키므로 전자, 전공의 발광재결합을 방해한다. Sample C는 기존의 Sample A 대비 다중양자우물층 내 유사한 정공농도를 갖으나 증가된 전자농도를 나타냄을 알 수 있다. 이는 Fig. 2에서 보이는 바와 같이 Al0.1GaN 장벽층에 의한 전도대 장벽을 생성함으로써 전자의 우물층 밖 넘침현상을 방지하여 캐리어 구속을 강화시키기 때문이다.
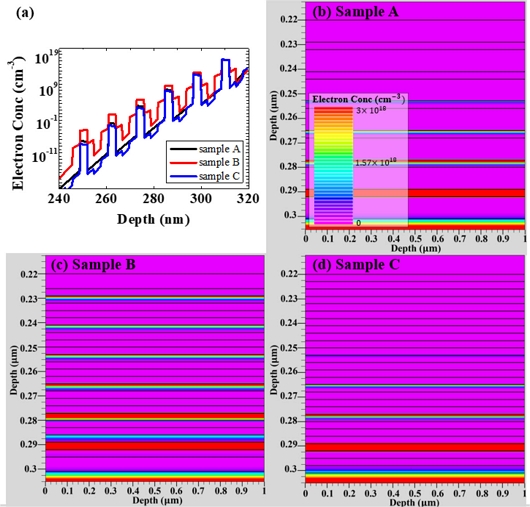
(a) Electron concentrations of the Sample A, B and C at 5 V according to the vertical depth. Electron concentration map of the (b) sample A, (c) sample B and (d) sample C at 5 V bias condition.
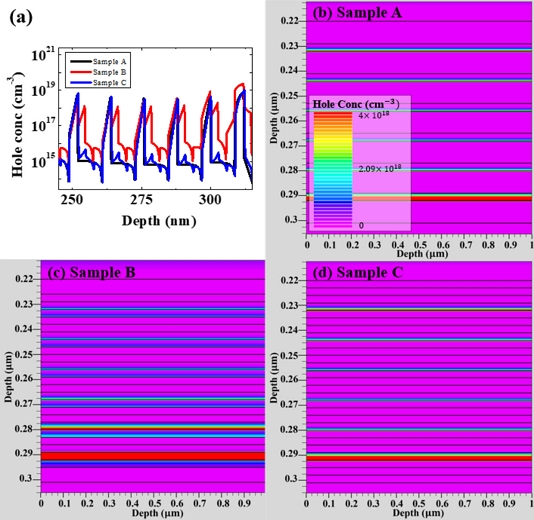
(a) Hole concentrations of the Sample A, B and C at 5 V according to the vertical depth. Hole concentration map of the (b) sample A, (c) sample B and (d) sample C at 5 V bias condition.
Fig. 5 (a)는 Sample A, B, C 에 대한 5 V 전압 인가 시 다중 양자우물층의 소자 깊이에 따른 재결합율을 보여준다. Fig. 5(b), (c), (d)는 Sample A, B, C에 대하여 5 V 전압 인가 시, 다중 양자 우물 내 위치에 따른 전자와 정공의 재결합율 (recombination rate)를 보여준다. Sample A, B, C 모두 In0.2GaN 양자우물 층에서 뚜렷한 재결합율을 나타내며, Sample B가 Sample A, C 대비 높은 재결합율을 나타낸다. Sample A, B, C 모두 n형 GaN 층에 가까워질수록 재결합율이 높아지는 양상을 보여준다. 재결합율의 최댓값은 Sample A, B, C에 대하여 각각 5.53×1027, 5.57×1028, 6.40×1027 cm−3·s 이며, Sample B는 기존의 Sample A대비 10배 이상의 최대 재결합율을 나타낸다. Sample B가 가장 높은 재결합율을 가지는 현상은 GaN/In0.1GaN/In0.2GaN/In0.1GaN/GaN의 양자우물 구조에서 In0.1GaN 완충장벽에 의한 분극 현상에 의한 양자우물 내 전자, 전공의 높은 농도 유지로 인한 결과이다.
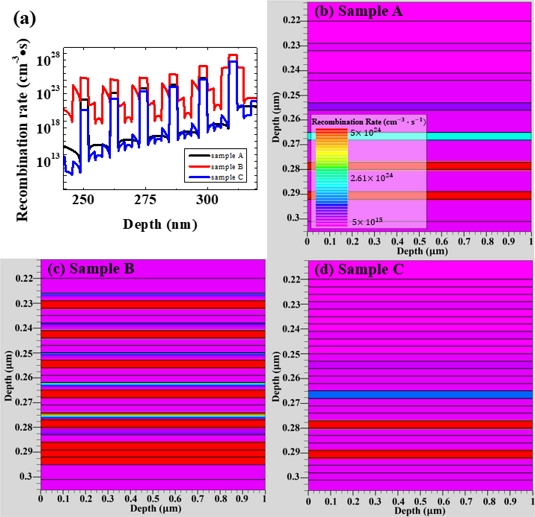
(a) Recombination rates of the Sample A, B and C at 5 V as a function of the vertical depth. Recombination rate map of the (b) sample A, (c) sample B and (d) sample C at 5 V bias condition.
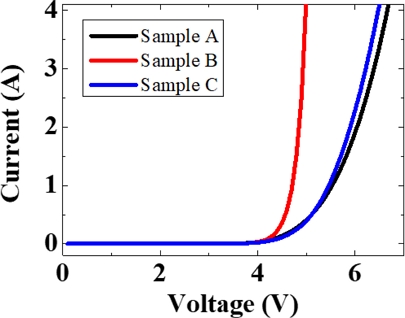
Fig. 6은 LED 전압 인가에 따른 Sample A, B, C의 전류 특성을 나타낸다. 동일한 In0.2GaN 양자우물층을 갖는 Sample A, B ,C에 대하여 Sample A, C는 각각 4.50 V, 4.58 V의 문턱전압(turn-on voltage)을 가지는 것에 반해, In0.1GaN 완충장벽층을 갖는 Sample B는 4.30 V의 가장 낮은 문턱전압을 나타내었다. 또한, Sample B는 Sample A, C에 비해 동일 전압 인가 시 더 높은 전류량을 보여준다. 5 V 전압을 인가 시 Sample A는 0.147 A, Sample C는 0.141 A인 반면, Sample B는 1.54 A로 양자우물층의 재결합전류의 증가에 따른 향상된 전압-전류 특성을 나타낸다.
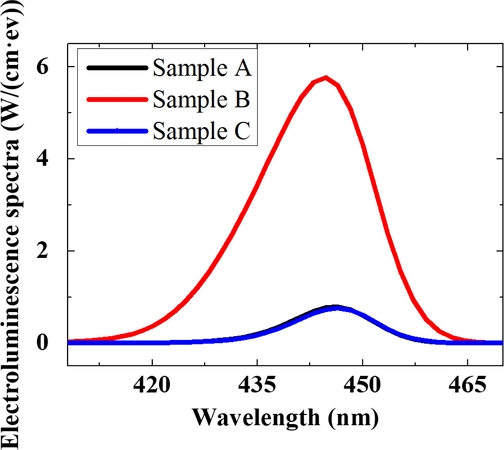
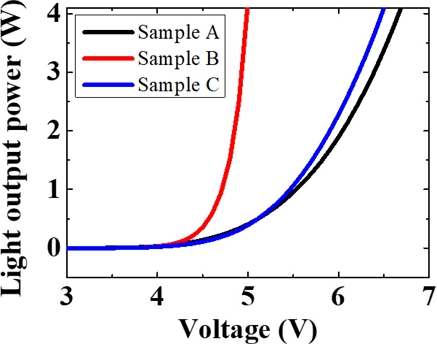
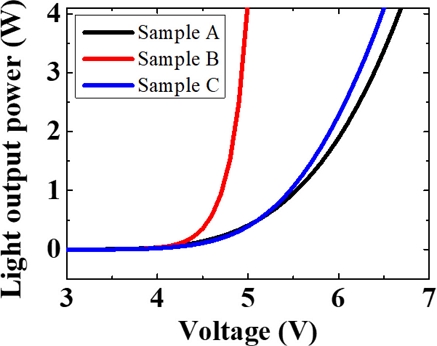
Fig. 7은 5 V 전압을 인가하였을 때 Sample A, B, C의 전기 발광 스펙트럼을 나타낸다. Sample A, B, C는 동일한 청색 파장인 450 nm에서 최대 방출(peak emission)을 보였다. 최대 방출 파장에서 전기발광 크기는 Sample A, C가 유사한 양상을 나타내었으며, Sample B는 앞의 두 소자 대비 크게 향상된 발광 특성을 보여준다. 이는 앞에서 언급한 Sample B의 높은 재결합율로 인한 결과임을 확인할 수 있다. Fig. 8은 인가전압의 변화에 따른 Sample A, B, C의 광출력(Light output, LOP) 특성을 나타낸다. Sample B는 4.8 V 이상에서 인가전압 하에서 전압 증가에 따른 광출력의 뚜렷한 증가 양상을 나타내며 Sample A, C는 각각 5.9 V, 5.5 V 이상에서 인가전압이 증가함에 따라 광출력이 증가하였다. 5 V를 인가하였을 때 Sample A는 0.408 W, Sample C는 0.392 W의 광출력을 나타낸 반면, Sample B는 4.22 W로 광출력이 크게 향상된 것을 볼 수 있다. 이와 같은 향상은 Sample B의 광출력은 Sample A 대비 9.3배, Sample C 대비 9.7배 향상된 것을 확인할 수 있다.
Fig. 9은 주입전류 증가에 따른 Sample A, B, C에 대한 상대적 외부양자효율을 나타낸다. 주입전류 0 ~ 1.4전류 범위에서 Sample A, B, C 모두 주입전류 증가에 따른 외부양자효율 감소의 효율드룹 현상을 나타내었다. 그러나 Sample B는 Sample A, C 대비 상대적으로 완화된 효율드룹 경향을 보여준다. Sample B는 기존의 Sample A 대비 18%, Sample C는 1.4%의 효율드룹 완화를 나타내었다. 효율드룹의 원인으로 고전류 주입에 따른 분극현상에 의한 누설전류를 들 수 있다. Sample B는 In0.1GaN 완층장벽에 의한 분극현상의 완화로 효율드룹이 완화되었으며, Sample C는 Al0.1GaN 장벽층의 강화에 따른 누설전류 감소로 효율드룹이 감소한 것으로 추정된다.
4. 결 론
바이오센서 기기의 광원으로 적용이 가능한 6주기의 동일한 In0.2GaN 양자우물층을 갖으나 상이한 장벽층을 갖는 LED 소자의 전기적, 광학적 특성이 소자모사를 통하여 분석되었다.
5 V 인가전압 하에서 GaN/In0.1GaN/In0.2GaN/In0.1GaN /GaN 양자우물 구조를 갖는 Sample B가 기존의 GaN /In0.2GaN/GaN 구조를 갖는 Sample A 및 Al0.1GaN/GaN /In0.2GaN/GaN/Al0.1GaN 구조를 갖는 Sample C 대비 양자우물 내 높은 전자 및 전공 농도를 나타냈다. Sample A, B, C는 각각 5.53×1027, 5.57×1028, 6.40×1027 cm−3·s의 최대 발광 재결합율을 가지며, Sample B는 기존의 Sample A 대비 10배 이상의 향상된 특성을 보여주었다. 이는 Sample B의 In0.1GaN의 완충장벽층 적용에 따른 분극현상의 완화에 인한 것으로, 이에 따라 더욱 향상된 전류-전압, 광출력-전압, 전기발광, 효율드룹 특성을 나타내었다. 본 논문에서 연구된 GaN/In0.1GaN/In0.2GaN /In0.1GaN/GaN 다중 양자우물층기반 LED는 바이오 센서 장치의 극소량 분석물 탐지를 위한 효율드룹 현상을 최소화한 고출력, 고효율 광원으로 활용될 수 있을 것으로 기대된다.
Acknowledgments
이 성과는 정부(과학기술정보통신부)의 재원으로 한국연구재단의 지원을 받아 수행된 연구이며(No. 2021R1F1A1056647),2022년도 정부(산업통상자원부)의 재원으로 한국산업기술진흥원의 지원을 받아 수행된 연구임 (P0020966, 2022년 산업혁신인재성장지원사업).
REFERENCES
-
K. S. Hwang, S. K. Kim, and T. S. Kim, “Biosensors: a review”, J. Sens. Sci. Technol., Vol. 18, No. 4, pp. 251-262, 2009.
[https://doi.org/10.5369/JSST.2009.18.4.251]

-
T. W. Kim and I. K. Park, “Skin-interfaced Wearable Biosensors: A Mini-Review”, J. Sens. Sci. Technol., Vol. 31, No. 2, pp. 71-78, 2022.
[https://doi.org/10.46670/JSST.2022.31.2.71]

-
P. Damborský, J. Švitel, and J. Katrlík, “Optical biosensors”, Essays. Biochem., Vol. 60, No. 1, pp. 91-100, 2016.
[https://doi.org/10.1042/EBC20150010]

- V. P. Rachim, J. An, Q. N. Pham, and W.-Y. Chung, “RGB-LED-based Optical Camera Communication using Multilevel Variable Pulse Position Modulation for Healthcare Applications”, J. Sens. Sci. Technol., Vol. 27, No. 1, pp. 6-12, 2018.
-
B. A. Prabowo, A. Purwidyantri, and K.-C. Liu, “Surface plasmon resonance optical sensor: A review on light source technology”, Biosensors, Vol. 8, No. 3, pp. 80(1)-80(27), 2018.
[https://doi.org/10.3390/bios8030080]

-
T. Arakawa, T. Koshida, T. Gessei, K. Miyajima, D. Takahashi, H. Kudo, K. Yano, and K. Mitsubayashi, “Biosensor for L-phenylalanine based on the optical detection of NADH using a UV light emitting diode”, Microchimica Acta, Vol. 173, No. 1-2, pp. 199-205, 2011.
[https://doi.org/10.1007/s00604-010-0536-5]

-
A. Wati, R. Rusva, and L. Umar, “Effect of LED Wavelengths and Light-Dark Cycle on Photosynthetic Production of Chlorella Kessleri for Algae-Based Biosensor Optimization”, J. Phys. Conf. Ser., Vol. 1351, No. 1, pp. 012003(1)-012003(7), 2019.
[https://doi.org/10.1088/1742-6596/1351/1/012003]

-
S. Y. Lee, K.-I. Park, C. Huh, M. Koo, H. G. Yoo, S. Kim, C. S. Ah, G. Y. Sung, and K. J. Lee, “Water-resistant flexible GaN LED on a liquid crystal polymer substrate for implantable biomedical applications”, Nano energy, Vol. 1, No. 1, pp. 145-151, 2012.
[https://doi.org/10.1016/j.nanoen.2011.07.001]

-
J.-C. Wang, C.-H. Fang, Y.-F. Wu, W.-J. Chen, D.-C. Kuo, P.-L. Fan, J.-A. Jiang, and T.-E. Nee, “The effect of junction temperature on the optoelectrical properties of InGaN/GaN multiple quantum well light-emitting diodes”, J. Lumin., Vol. 132, No. 2, pp. 429-433, 2012.
[https://doi.org/10.1016/j.jlumin.2011.09.001]

-
H. C. Lee, J. B. Park, J. W. Bae, P. T. T. Thuy, M. C. Yoo, and G. Y. Yeom, “Effect of the surface texturing shapes fabricated using dry etching on the extraction efficiency of vertical light-emitting diodes”, Solid-State Electron., Vol. 52, No. 8, pp. 1193-1196, 2008.
[https://doi.org/10.1016/j.sse.2008.05.005]

-
Y.-S. Wang, N.-C. Chen, C.-Y. Lu, and J.-F. Chen, “Optical joint density of states in InGaN/GaN based multiple-quantum-well light-emitting diodes”, Physica B: Condens. Matter, Vol. 406, No. 22, pp. 4300-4303, 2011.
[https://doi.org/10.1016/j.physb.2011.08.071]

-
B. Beaumont, S. Haffouz, P. Gibart, M. Leroux, Ph. Lorenzini, E. Calleja, and E. Munoz, “Violet GaN based light emitting diodes fabricated by metal organics vapour phase epitaxy”, Mater. Sci. Eng. B, Vol. 50, No.1-3, pp. 296-301, 1997.
[https://doi.org/10.1016/S0921-5107(97)00193-1]

-
C. Wetzel, M. Zhu, J. Senawiratne, T. Detchprohm, P. D. Persans, L. Lin, E. A. Preble, and D. Hanser, “Light-emitting diode development on polar and non-polar GaN substrates”, J. Cryst. Growth, Vol. 310, No. 17, pp. 3987-3991, 2008.
[https://doi.org/10.1016/j.jcrysgro.2008.06.028]

-
S. J. Chang, C. H. Kuo, Y. K. Su, L. W. Wu, J. K. Sheu, T. C. Wen, W. C. Lai, J. R. Chen, and J. M. Tsai, “400-nm InGaN – GaN and InGaN – AlGaN Multiquantum Well Light-Emitting Diodes”, IEEE J. Sel. Top. Quantum Electron., Vol. 8, No. 4, pp. 744-748, 2002.
[https://doi.org/10.1109/JSTQE.2002.801677]

-
C. Jia, T. Yu, X. Feng, K. Wang, and G. Zhang, “Performance improvement of GaN-based near-UV LEDs with InGaN/AlGaN superlattices strain relief layer and AlGaN barrier”, Superlattices and Microstructures, Vol. 97, pp. 417-423, 2016.
[https://doi.org/10.1016/j.spmi.2016.07.001]

-
I. V. Rozhansky and D. A. Zakheim, “Analysis of dependence of electroluminescence efficiency of AlInGaN LED heterostructures on pumping”, Phys. Status Solidi C, Vol. 3, No. 6, pp. 2160-2164, 2006.
[https://doi.org/10.1002/pssc.200565366]

-
A. Y. Kim, W. Götz, D. A. Steigerwald, J. J. Wierer, N. F. Gardner, J. Sun, S. A. Stockman, P. S. Martin, M. R. Krames, R. S. Kern, and F. M. Steranka, “Performance of high-power AlInGaN light emitting diodes”, Phys. Status Solidi A, Vol. 188, No. 1, pp. 15-21, 2001.
[https://doi.org/10.1002/1521-396X(200111)188:1<15::AID-PSSA15>3.0.CO;2-5]

-
M.-H. Kim, M. F. Schubert, Q. Dai, J. K. Kim, E. F. Schubert, J. Piprek, and Y. Park, “Origin of efficiency droop in GaN-based light-emitting diodes”, Appl. Phys. Lett., Vol. 91, No. 18, pp. 183507(1)-183507(3), 2007.
[https://doi.org/10.1063/1.2800290]

-
Y. C. Shen, G. O. Müller, S. Watanabe, N. F. Gardner, A. Munkholm, and M. R. Krames, “Auger recombination in InGaN measured by photoluminescence”, Appl. Phys. Lett., Vol. 91, No. 14, pp. 141101(1)-141101(3), 2007.
[https://doi.org/10.1063/1.2785135]

-
A. A. Efremov, N. I. Bochkareva, R. I. Gorbunov, D. A. Larinovich, Y. T. Rebane, D. V. Tarkhin, and Y. G. Shreter, “Effect of the joule heating on the quantum efficiency and choice of thermal conditions for high-power blue InGaN/GaN LEDs”, Semiconductors, Vol. 40, No. 5, pp. 605-610, 2006.
[https://doi.org/10.1134/S1063782606050162]

-
Y. Yang, X. A. Cao, and C. H. Yan, “Rapid efficiency roll-off in high-quality green light-emitting diodes on freestanding GaN substrates”, Appl. Phys. Lett., Vol. 94, No. 4, pp. 041117(1)-041117(3), 2009.
[https://doi.org/10.1063/1.3077017]

-
J.-Y. Chang, M.-C. Tsai, and Y.-K. Kuo, “Advantages of blue InGaN light-emitting diodes with AlGaN barriers”, Opt. Lett., Vol. 35, No. 9, pp. 1368-1370, 2010.
[https://doi.org/10.1364/OL.35.001368]

-
M. A. A. Z. M. Sahar, Z. Hassan, S. S. Ng, and N. A. Hamzah, “Highly efficient near ultraviolet LEDs using InGaN/Gan/AlxGa1-xN/GaN multiple quantum wells at high teperature on sapphire substrate”, Mater. Sci. Semicond. Process., Vol. 156, pp. 107298(1)-107298(9), 2023.
[https://doi.org/10.1016/j.mssp.2022.107298]

