Active Scanning Method for AUVs Using Entropy Maps Utilized with Underwater Sonar Measurements
This is an Open Access article distributed under the terms of the Creative Commons Attribution Non-Commercial License(https://creativecommons.org/licenses/by-nc/3.0/) which permits unrestricted non-commercial use, distribution, and reproduction in any medium, provided the original work is properly cited.
Abstract
This paper presents an active scanning method for an autonomous underwater vehicle (AUV) equipped with an image sonar to generate an underwater 3-dimensional (3D) map. As sonar information measured by AUVs is a useful feature to generate accurate 3D maps underwater, where high turbidity and signal attenuation are prevalent, we propose a two-stage seabed scanning method: 1) scan over a designated area to generate a 3D occupancy map and represent uncertain regions in the occupancy map in terms of entropy, and 2) find the most uncertain region with the highest entropy in the generated map and search for consecutive scan paths that can reduce the uncertainty of the map the most. The proposed scanning method was tested through computer simulations, in which the experimental settings (AUV, sensors, objects, and measurement conditions) were configured to be similar to those in the real world. The proposed method was compared with conventional lawnmower-based and uniform scanning methods by analyzing the precision, recall, and F-scores of the object shapes in the generated underwater maps. The results demonstrate that the proposed method can provide efficient scan paths and generate accurate underwater maps.
Keywords:
Autonomous robot exploration, Information theory, Occupancy grid map, Path planning, Underwater mapping1. INTRODUCTION
The exploration capabilities of autonomous underwater vehicles (AUVs) in unknown environments are important for ocean research, environmental monitoring, and resource exploration. To enable these capabilities, it is necessary to provide robots with highly reliable maps using technologies such as simultaneous localization and mapping (SLAM). In addition, in unknown underwater environments where teleoperation is limited, robots must autonomously generate active paths to build a map.
Robust mapping and autonomous exploration methodologies for mobile robots have been studied extensively. In particular, SLAM has been widely investigated and proven to be effective for many mobile robot sensing platforms [1-3]. In [4] and [5], a method was introduced to represent maps using entropy, a concept from information theory that expresses uncertainty. This approach enables robots to plan optimal paths autonomously and explore unknown environments. However, these studies have generally been validated on ground robot platforms that utilize optical cameras or LiDARs, which are effective on the ground. It has been experimentally verified that such sensors are not suitable for underwater environments because of their high turbidity and signal attenuation rate [6,7].
Owing to such harsh underwater sensing environments, AUVs often rely on acoustic-based sensors, such as forwardlooking and profiling sonars, to acquire nearby information. Image sonar is a widely used sensor for underwater exploration that measures the features (time-of-flight and intensities) of sonar reflections by projecting multiple sonar beams and receiving the reflected signals. It then provides feature measurements in 2-dimensional (2D) images. However, sonar measurements have low signal-to-noise ratios (SNR), and their elevation information is lost owing to the 2D image generation mechanism of image sonar [8,9]. Therefore, a method that considers these limitations is required when applying image sonar to underwater mapping. [10] and [11] proposed a space-carving-based underwater mapping technique, and [12] introduced a method for restoring the shapes of underwater objects by combining an image sonar with a rotational instrument. However, these methods require multiple sonar images and the AUV to remain stationary or follow ideal paths, which are difficult to achieve using real AUVs. [13] and [14] proposed methods for generating 3D point clouds using forward-moving AUVs. However, owing to the limitations of the field-of-view (FoV) of the sensor, it is not possible to reconstruct the overall shape of objects that exceed the FoV using a single scan. To address this issue, [15] proposed a method for reconstructing underwater objects using sonar images obtained from different scan paths while optimally selecting consecutive scanning directions. However, this approach relies on 2D sonar image data to generate the next scan path and align the scanned information, resulting in less accurate reconstruction results when applied to objects with unstructured shapes.
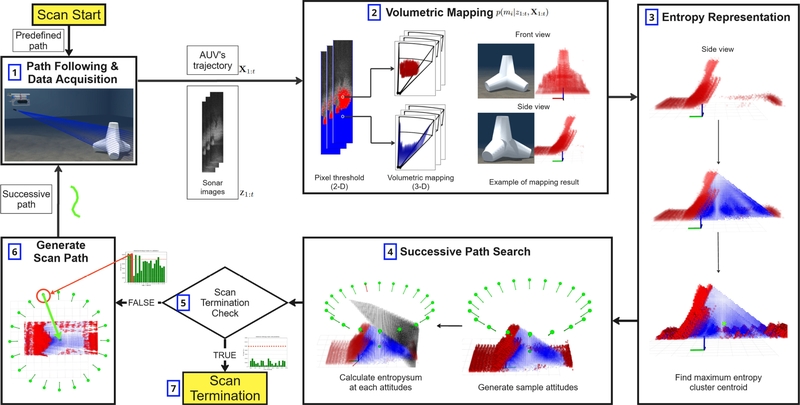
To overcome these limitations, this study proposes a two-stage underwater scanning method for AUVs for efficient underwater mapping (Fig. 1). In the first stage, the robot follows a predefined scanning path and generates a probabilistic 3-dimensional (3D) volumetric map using the 2D image sonar data acquired during the process. In the second stage, the probabilistic map is represented based on entropy, and a successive path that can scan the most uncertain region is generated and followed. Simulation results show that the proposed method provides efficient AUV scan paths to achieve accurate 3D reconstruction of seabed topography and underwater objects. The proposed method enables the autonomous exploration of AUVs in unknown underwater environments.
2. Method
The pipeline of the proposed method is illustrated in Fig. 2, where the two-stage process is divided into seven distinct steps. The process begins with the generation of an initial volumetric map from sonar data collected as the AUV follows a predefined scan path. This volumetric map is then converted into an entropy map to identify the region with the highest uncertainty. Using this information, the successive scanning attitudes and paths that minimize map uncertainty are determined. The entire process is iterated until the fifth stage, as shown in Fig. 2, where an entropy summation check is performed. The detailed implementation and explanation of each step are provided in the following subsections.
2.1 3D Volumetric Mapping Using Sonar Images
Volumetric mapping is a method for probabilistically estimating a map based on AUV attitude and sensor data in an environment with uncertainty. The environment is represented as a collection of volumetric elements such as grids and voxels. In this study, we used a 3D occupancy voxel map for underwater navigation, in which the occupancy probability of each voxel was updated with each new observation. The AUV's attitude is represented by the state vector X=[xr yr zr Φr θr ψr]T, and the observation data Z is a sonar image represented as a 2D matrix. The entire map M is a set of voxels m1,m2,...,mn each representing an occupancy state. Voxel mi is represented by a state vector [xim yim zim]T, and the occupancy probability of the voxel is represented by p(mi) . Assuming that each voxel mi is independent, the probability of the entire map M is defined as
| (1) |
The map is updated based on the observations Zt and AUV attitude Xt over time t. The probability that voxel mi is occupied, p(mi ∣ Z1:t,X1:t), is calculated as follows:
| (2) |
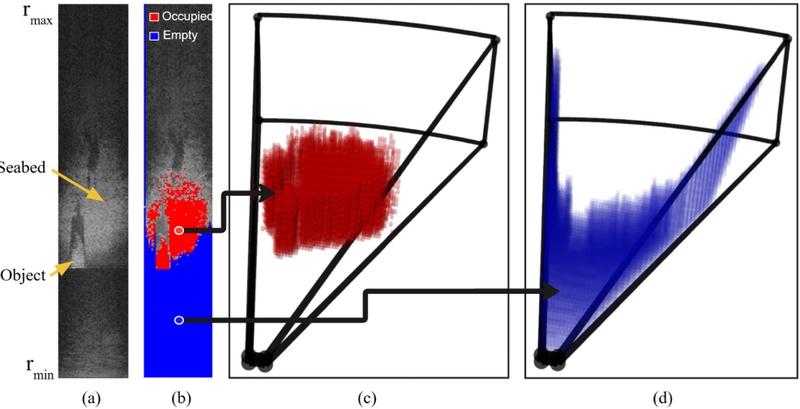
Here, η represents the normalization term that ensures that the raw sonar image is analyzed according to predefined criteria, distinguishing between occupied and empty pixels, as shown in Fig. 3 (b). Because of the sonar characteristics, these pixels do not provide elevation information in the 3D world's spherical coordinate system. Therefore, as illustrated in Figs. 3 (c) and (d), all the voxels corresponding to the pixel within the sonar FoV from Xt are searched, and the occupancy probability of each cell is updated using Eq. (2). As the AUV moves along a designated path and updates the map based on multiple sonar images, the approximate shape of the seabed can be obtained, allowing the creation of an initial map.
2.2 Entropy-Based Map Representation
The underwater volumetric mapping method described above has the advantage of providing approximate height information of objects and the seabed; however, it also has some limitations. In particular, owing to the characteristics of sonars, no information can be obtained in the shadow region behind objects. This issue arises from the imaging mechanism of sonars and requires additional observations in these areas. To address this problem, we introduced an entropy map [16]. The entropy map quantitatively represents the uncertainty of each voxel. The entropy H(mi) of each voxel, mi is calculated using the following equation:
| (3) |
This equation is a binary entropy function that represents the uncertainty of a voxel's occupancy state as a value between 0 and 1. An entropy close to 1 indicates high uncertainty regarding the state of the voxel, whereas a value close to 0 indicates high certainty. Using this representation, the AUV can identify the most uncertain high-entropy regions in the initial map. These regions can then be used as waypoints for an optimal secondary scan path.
2.3 Finding Successive Scan Paths Using Entropy Map
Using the previously generated entropy map, the 3D position of each voxel in the map was correlated with its uncertainty, allowing calculation and analysis. To identify the most uncertain point in the current map, we utilized the DBSCAN algorithm, which is a clustering method that groups neighboring points within a specified radius. Thus, multiple clusters with high entropy values can be identified on the map. The center of each cluster is considered a candidate point for the next scan. Among these clusters, the cluster with the largest number of high-entropy voxels is selected as Cmax , and its centroid position is defined as Xcenter=[xc yc zc] T. Once Xcenter is determined, the next step is to calculate the successive path for scanning it. For this, candidate scan attitudes (X ∈ R6) are generated around Xcenter. Among the N candidate attitudes, one is defined as Pisample. Given the characteristics of the conventional hovering-type AUV used, the roll and pitch values are assumed to remain constant. The generated candidate attitudes are expressed as follows:
| (4) |
| (5) |
Because the AUV is assumed to maintain a constant altitude, the initial altitude, zinitial, is used for all sample points. The parameter r is defined as the radius of Cmax, determined by the maximum distance of the points Cmax within in the xy-plane. For each generated Pisample, the entropy summation (Hisum) is calculated. This calculation reflects the characteristics of the proposed sonar-image-based volumetric mapping method. Each beam of the image sonar corresponds to a column of the sonar image. The sonar image is explored column-by-column from the minimum to maximum range. During this process, only empty pixels before the first occupied pixel are considered valid and integrated into the map. Similarly, the entropy summation for each candidate attitude is calculated by summing the entropy values of the voxels between the attitude and the first occupied voxel along each beam. Hisum is defined as follows:
| (6) |
where B represents the total number of beams in the image sonar, which consists of multiple sonar beams, and b refers to an individual sonar beam within B. The term dboccupied represents the distance between the sonar pose and closest occupied voxel within beam b. Finally, the candidate attitude with the maximum entropy summation value is selected as the successive attitude for scanning, Pnext.
| (7) |
The successive scanning path starts from Pnext and consists of k waypoints Pjpath connecting Pnext to Xcenter, which are calculated through linear interpolation. The set of waypoints is defined as follows:
| (8) |
Following this approach, the AUV generates a successive scanning path, enabling it to scan the most uncertain region in the initial map and effectively reduce map uncertainty.
2.4 Scan Termination Criteria
By continuing the scanning process described above, the entropy of Cmax gradually decreases. However, because of the image-sonar sensor mechanism, voxels that are physically inside the object (i.e., those within the volume that constitutes the object’s interior) cannot be detected; thus, their associated entropy cannot be reduced. Because Cmax includes the entropy of these internal voxels, the total entropy of Cmax cannot be reduced beyond a certain lower bound. Therefore, we calculate the extent to which Hisum, computed for each Pisample, can reduce the total entropy of by considering the characteristics of the sensor mechanism of the image sonar. This value is then compared with a predefined termination criterion (TC) to determine whether the next scan is meaningful. The corresponding equations are defined as follows:
| (9) |
Here, TC has a value between 0 and 1, determined based on factors such as the FoV of the beam and allowable scanning time. If the above equation is satisfied, the scanning process is terminated.
3. EXPERIMENTS
The proposed methodology was validated using an ROS-based UUV-Sim [17] environment. The experiments were conducted under two scenarios. Fig. 4 illustrates the experimental environment of each scenario and provides sample sonar images obtained under these settings [18]. Scenario 1 features a terrain with a tetrapod, whereas Scenario 2 involves a shipwreck positioned in the same location. In Scenario 1, the object was fully contained within the FoV of the sonar, whereas in Scenario 2, it was significantly larger than the FoV of the sonar. Detailed information on the environmental settings and sonar configurations for each scenario is listed in Table 1.
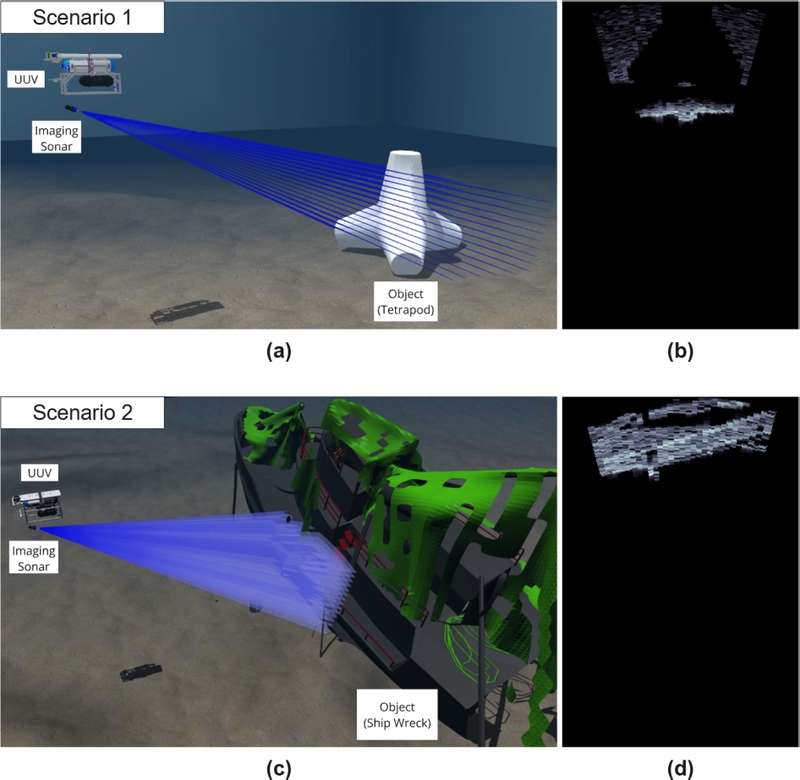
Simulation settings of two scenarios: (a), (c) simulation environments; (b), (d) sonar image examples.
The AUV ‘Cyclops’ [19] used in the experiment is a hovering-type AUV that is equipped with six thrusters for its 4 degrees of freedom control (without roll and pitch control). The AUV estimates its state using the IMU and DVL sensors and maintains its position through PID control based on the estimated states and thruster outputs. To collect the observational data, an image sonar tilted 30° downward toward the seabed was mounted at the bottom of the AUV.
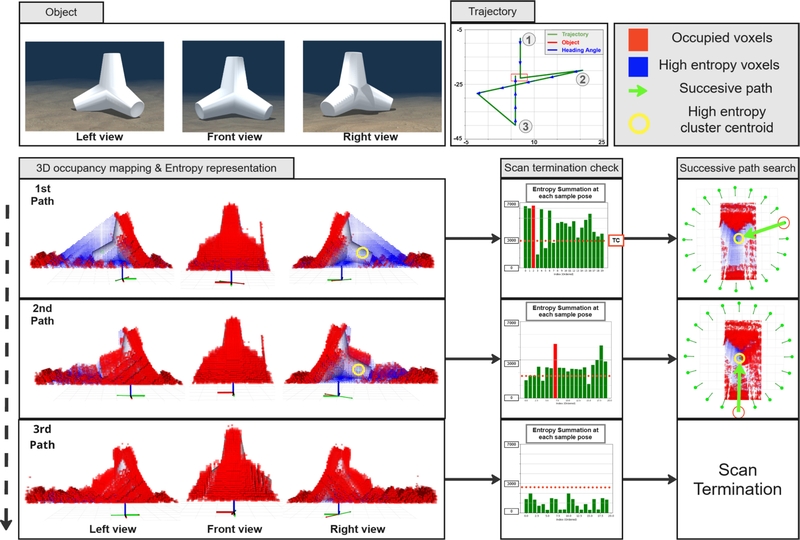
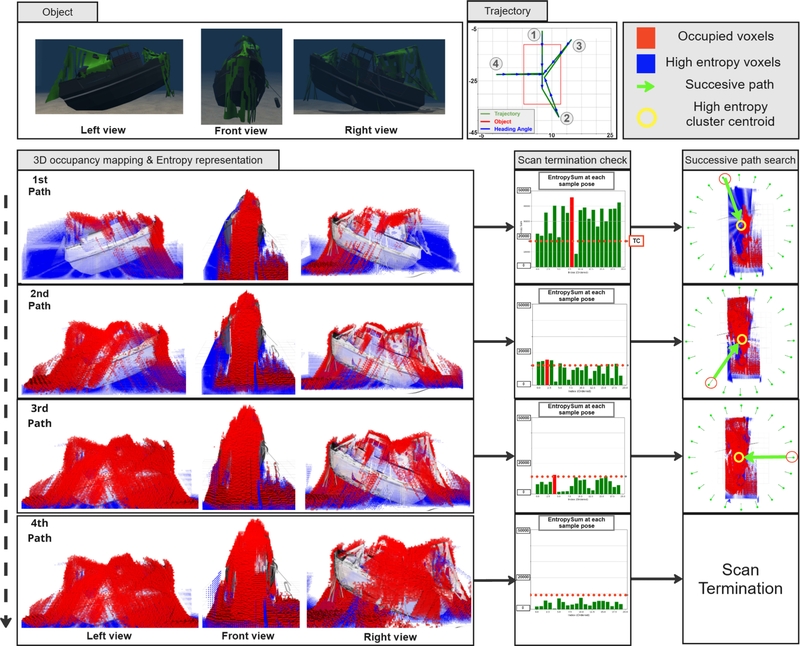
In Scenarios 1 and 2, 20 sample poses were generated, and the predefined path was set as a straight line passing over the center of the object. Using the ground-truth values provided by Gazebo, the robot and sensor poses were assumed to be accurate. The total trajectory for each scenario can be found in the “trajectory” section of Fig. 5 and Fig. 6.
In Scenario 1, the object was sized such that it fit entirely within the FoV of the sensor. Consequently, most of the front surface of the object was reconstructed after the initial scan. A significant amount of entropy was formed on the rear side of the object, leading to the generation of Xcenter for Cmax at the center of the rear side. The radius r was determined to be 5 m based on the x-y plane radius of Cmax, and the sample poses were generated accordingly. Excluding the initial scan path, two additional scans were performed, with each successive scan path depicted as green paths under the “successive path search” section of Fig. 5. During the third scan, the scan TC determined that all Hisum had failed to exceed the TC, and the scanning was terminated.
In Scenario 2, unlike in Scenario 1, the object was larger than the FoV of the sensor, indicating that not all parts of the object were captured in the initial scan. Consequently, a significant entropy was observed on both the rear and side surfaces of the object. Additionally, because of the large size of the object, Cmax was generated not at the rear of the object but within its interior. The radius r was determined to be 8 m, resulting in the generation of sample poses over a wider area compared with that in Scenario 1. Excluding the initial scan path, three additional scans were conducted, and these successive scan paths are also depicted as green paths under the “Successive path search” section of Fig. 6. In the fourth scan, all Hisum images failed to exceed the TC, and the scan was terminated.
4. RESULTS
The object-reconstruction rate was assessed to evaluate the accuracy of the proposed mapping method. A ground truth voxel map was generated based on the model used in the simulation. The comparison between the volumetric map generated by the proposed method and the ground truth voxel map was conducted using the following metrics, namely precision (P), recall (R), and Fβ score.
| (10) |
| (11) |
| (12) |
Here, TP refers to the voxels present in the ground-truth model and that were successfully reconstructed in the mapping results. False positive (FP) represents noise voxels that are not in the ground truth model but are generated in the mapping results. False negative (FN) refers to voxels that exist in the ground-truth model but are missing from the mapping results.
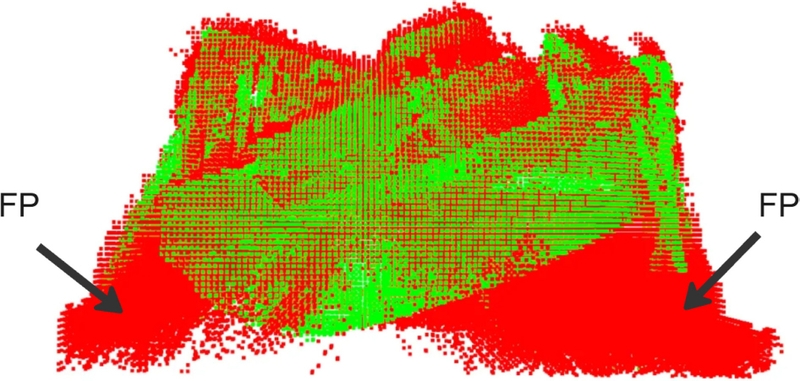
The object reconstruction accuracy of the proposed method was compared with data obtained from two different scanning paths. The mapping process followed the approach outlined in Section 2.1. For the lawnmower path, scanning was conducted from a position where the object was initially not visible in the sonar FoV, thereby ensuring that the entire object passed through the scanning area. For the uniform path, the number of scans matched the number of scans in the proposed method, dividing 360° into equal segments. The heading angle was set to align with the object, creating straight paths passing over its center. The path shapes for the lawnmower and uniform methods are shown in Fig. 7. Tables 2 and 3 present the evaluation results of the reconstructed seabed objects in Scenarios 1 and 2, respectively, comparing the proposed method with the reference paths in terms of precision, recall, and F-scores. It can be observed that the precision values are lower than the recall values. This is because a significant number of voxels were classified as FPs. As shown in Fig. 8, this occurs because of the limitations of the image sonar mechanism, specifically, the lack of elevation information, which results in the generation of voxels at the bottom of the object that are counted as FPs.

Comparison of scan paths: (a) lawnmower path, (b) uniform path in scenario 1, (c) uniform path in scenario 2
5. CONCLUSIONS
This study proposes a two-stage scanning method for the efficient 3D reconstruction of unknown seabed topography and underwater objects. In the first stage, a 3D occupancy map was generated using underwater image sonar. In the second stage, the initially generated map was transformed into an entropy map, which was used to generate the next scan path. The data acquired along the new scan paths were used to continuously update the seabed topography and objects. To determine the next scan path, an entropy summation method reflecting the characteristics of the sonar image mechanism was proposed. This method quantitatively defines meaningful scans based on the ratio of the remaining entropy summation to the entropy that can be acquired from the candidate scan poses, allowing the robot to autonomously terminate the scanning process. This study conducted computer simulations of two scenarios, demonstrating that the underwater robot could autonomously generate and follow paths based on the initially created map and update the map iteratively. The reconstruction accuracy of the proposed method was found to be higher than or comparable with that achieved using predefined comparison paths in terms of both the precision and recall of the reconstructed objects.
Acknowledgments
This research was supported by the industry–academia cooperation project LIG NEX1.
References
-
C. Cadena, L. Carlone, H. Carrillo, Y. Latif, D. Scaramuzza, J. Neira, et al., Past, present, and future of simultaneous localization and mapping: Toward the robust-perception age, IEEE Trans. Robotics 32 (2016) 1309–1332.
[https://doi.org/10.1109/TRO.2016.2624754]

-
G. Bresson, Z. Alsayed, L. Yu, S. Glaser, Simultaneous localization and mapping: A survey of current trends in autonomous driving, IEEE Trans. Intell. Vehicles 2 (2017) 194–220.
[https://doi.org/10.1109/TIV.2017.2749181]

-
C. Debeunne, D. Vivet, A review of visual-lidar fusion based simultaneous localization and mapping, Sensors 20 (2020) 2068.
[https://doi.org/10.3390/s20072068]

-
T. Henderson, V. Sze, S. Karaman, An efficient and continuous approach to information-theoretic exploration, Proceedings of 2020 IEEE Int. Conf. Robotics Autom. (ICRA), Paris, France, 2020, pp. 8566–8572.
[https://doi.org/10.1109/ICRA40945.2020.9196592]

-
Z. Zhang, T. Henderson, S. Karaman, V. Sze, Fsmi: Fast computation of shannon mutual information for information-theoreticmapping, Int. J. Robotics Res. 39 (2020) 1155–1177.
[https://doi.org/10.1177/0278364920921941]

-
B. Joshi, S. Rahman, M. Kalaitzakis, B. Cain, J. Johnson, M. Xanthidis, et al., Experimental comparison of open source visual-inertial-based state estimation algorithms in the underwater domain, Proceedings of 2019 IEEE/RSJ Int. Conf. Intell. Robots Syst. (IROS), Macau, China, 2019, 7227–7233.
[https://doi.org/10.1109/IROS40897.2019.8968049]

-
B. Joshi, M. Xanthidis, M. Roznere, N.J. Burgdorfer, P. Mordohai, A.Q. Li, I. Rekleitis, Underwater exploration and mapping, Proceedings of 2022 IEEE/OES Autonomous Underwater Vehicles Symp. (AUV), Singapore, 2022, pp. 1–7.
[https://doi.org/10.1109/AUV53081.2022.9965805]

-
M.D. Aykin, S. Negahdaripour, On feature matching and image registration for two-dimensional forward-scan sonar imaging, J. Field Robotics 30 (2013) 602–623.
[https://doi.org/10.1002/rob.21461]

-
S. Negahdaripour, On 3-d motion estimation from feature tracks bin 2-d fs sonar video, IEEE Trans. Robotics 29 (2013) 1016–1030.
[https://doi.org/10.1109/TRO.2013.2260952]

-
M.D. Aykin, S. Negahdaripour, Three-dimensional target reconstruction from multiple 2-d forward-scan sonar views by space carving, IEEE J. Oceanic Eng. 42 (2017) 574–589.
[https://doi.org/10.1109/JOE.2016.2591738]

-
S. Negahdaripour, Application of forward-scan sonar stereo for 3-d scene reconstruction, IEEE J. Oceanic Eng. 45 (2020) 547–562.
[https://doi.org/10.1109/JOE.2018.2875574]

-
Y. Wang, Y. Ji, H. Woo, Y. Tamura, H. Tsuchiya, A. Yamashita, et al., Acoustic camera-based pose graph slam for dense 3-d mapping in underwater environments, IEEE J. Oceanic Eng. 46 (2021) 829–847.
[https://doi.org/10.1109/JOE.2020.3033036]

-
H. Cho, B. Kim, S.-C. Yu, Auv-based underwater 3-d point cloud generation using acoustic lens-based multibeam sonar, IEEE J. Oceanic Eng. 43 (2018) 856 872.
[https://doi.org/10.1109/JOE.2017.2751139]

-
H. Joe, J. Kim, S.-C. Yu, Probabilistic 3D reconstruction using two sonar devices, Sensors 22 (2022) 2094.
[https://doi.org/10.3390/s22062094]

-
B. Kim, J. Kim, H. Cho, J. Kim, S.-C. Yu, Auv-based multi-view scanning method for 3-d reconstruction of underwater object using forward scan sonar, IEEE Sensors J. 20 (2020) 1592–1606.
[https://doi.org/10.1109/JSEN.2019.2946587]

-
C.E. Shannon, A mathematical theory of communication, Bell Syst. Tech. J. 27 (1948) 379–423.
[https://doi.org/10.1002/j.1538-7305.1948.tb01338.x]

-
M.M.M. Manhães, S.A. Scherer, M. Voss, L.R. Douat, T. Rauschenbach, UUV simulator: A gazebo-based package for underwater intervention and multi-robot simulation, Proceedings of OCEANS 2016 MTS/IEEE Monterey, Monterey, USA, 2016, pp. 1–8.
[https://doi.org/10.1109/OCEANS.2016.7761080]

-
M.M. Zhang, W.-S. Choi, J. Herman, D. Davis, C. Vogt, M. McCarrin, et al., Dave aquatic virtual environment: Toward a general underwater robotics simulator, proceedings of 2022 IEEE/OES Autonomous Underwater Vehicles Symp. (AUV), Singapore, 2022, pp. 1–8.
[https://doi.org/10.1109/AUV53081.2022.9965808]

-
J. Pyo, H. Cho, H. Joe, T. Ura, S.-C. Yu, Development of hovering type AUV “cyclops” and its performance evaluation using image mosaicing, Ocean Eng. 109 (2015) 517–530.
[https://doi.org/10.1016/j.oceaneng.2015.09.023]


