Numerical and Multiphysics Simulation of Flexible PMN-PT 1-3 Ultrasonic Transducer Arrays for Noninvasive Vascular Monitoring
ⓒ The Korean Sensors Society
This is an Open Access article distributed under the terms of the Creative Commons Attribution Non-Commercial License (https://creativecommons.org/licenses/by-nc/3.0/) which permits unrestricted non-commercial use, distribution, and reproduction in any medium, provided the original work is properly cited.
Abstract
In this study, we present a simulation-driven framework to design a flexible ultrasonic transducer array (UTA) based on the PMN-PT 1-3 piezoelectric composite for noninvasive vascular monitoring. The effect of transducer aperture and array configuration on the acoustic beam performance in tissue models was evaluated using MATLAB and COMSOL Multiphysics. We employed a target vessel embedded at a depth of 7.3 mm with a diameter of 2.7 mm as a reference to evaluate the pulse-echo response. A vessel diameter of 2.7 mm utilizing a single transducer element, which was expanded to include a full array, was observed through simulation. Additionally, focused beam simulation presented a peak pressure of 4.3 kPa, when compared with the pressure of 1.2 kPa observed in the unfocused case, demonstrating significant intensity gain through delay-based focusing. The B-mode images generated using delay-and-sum (DAS) beamforming in MATLAB demonstrated strong lateral confinement of the acoustic beam around the target vessel location. The proposed hybrid modeling approach enables the efficient design of wearable UTAs prior to fabrication and supports the future development of high-resolution, skin-conformal ultrasound devices.
Keywords:
Flexible ultrasonic transducer, PMN-PT 1-3 composite, COMSOL multiphysics, Acoustic simulation, Vascular modeling, Delay and Sum1. INTRODUCTION
Cardiovascular diseases are the primary cause of morbidity and mortality worldwide, with hypertension identified as a key modifiable risk factor [1]. The blood pressure must be continuously monitored for early intervention and long-term management; however, the existing cuff-based technologies are limited by intermittent operation and bulky form factors. As a promising alternative, ultrasound-based systems are emerging because of their capability for real-time, noninvasive assessment of vascular conditions [2,3]. However, conventional ultrasound probes are typically rigid, making them unsuitable for prolonged skin contact and integration with wearable systems [4].
Recent advances in piezoelectric materials and flexible electronics promoted the development of conformable ultrasonic transducer arrays (UTAs) that can maintain prolonged skin contact and ensure improved acoustic coupling [5,6]. Among the various materials that were analyzed, lead magnesium niobate-lead titanate (PMN-PT) 1-3 composites have gained considerable interest owing to their high electromechanical coupling, flexibility, and efficient acoustic performance [7-10]. Despite their potential, the design parameters of flexible UTAs, such as the element pitch, size, and array geometry, pose complex challenges in optimization as these characteristics directly influence the acoustic beam quality, penetration depth, and imaging resolution [11]. Several simulation models were developed in previous studies, particularly in the context of non-destructive testing (NDT), such as defect localization and crack identification in solid structures, where ultrasonic transducers were typically modeled to evaluate wave propagation through rigid homogeneous media [12]. Other simulation models have analyzed dual-functionality transducers that can operate as both transmitters and receivers in controlled environments [13]. Further advances in multiphysics simulations contributed significantly to the design and optimization of piezoelectric composites, thereby enabling accurate prediction of the electromechanical coupling and mechanical durability prior to fabrication. In particular, the numerical analysis of PDMS–CNT/graphite composites and PZT/epoxy nanocomposites have demonstrated the contribution of computational modeling on material selection and structural configuration to enhance the piezoelectric sensitivity and operational stability [14,15]. However, these models are primarily mechanical or structural in focus, with limited literature on modeling complex acoustic–mechanical interactions in biological tissues. In addition, narrowing the focus to vascular imaging, simulation-based studies that reflect biologically realistic scenarios, such as the detection and characterization of blood vessels embedded within soft and multilayered tissues, are scarce. Thus, most previous studies did not address the heterogeneous, layered properties of human tissue or the dynamic interaction of ultrasound waves with vascular structures.
The novelty of this study lies in the establishment of a hybrid modeling framework that integrates transducer array calculation_GUI (TAC_GUI) parametric analysis, COMSOL-based multiphysics simulations, and MATLAB ultrasound toolbox (MUST) beamforming in a unified workflow. Unlike earlier acoustic field simulations that considered isolated aspects of modeling, the proposed approach integrated rapid aperture design with acoustic field simulations and realistic B-mode image formation. This helped in quantitatively predicting vascular diameters with sub-millimeter accuracy, presenting a practical pathway for the pre-fabrication optimization of flexible ultrasonic arrays [16]. In the literature, the limited studies on acoustic–tissue interactions, vessel curvature detection, and receiving beam angle, show discrepancies between the simulated results and real-world performance. These limitations necessitate experimental validation to ensure the reliability of simulations in medical applications [11,17,18].
MATLAB and COMSOL are widely implemented in ultrasound transducer modeling; however, they both face significant limitations when applied individually. MATLAB-based tools, such as TAC_GUI, enable rapid and computationally efficient parametric analysis, but assume homogeneous media, overlooking boundary effects, tissue heterogeneity, and material anisotropy; these factors cause deviations from the in-vivo performance. Conversely, COMSOL Multiphysics presents high-fidelity finite element modeling that resolves the coupled piezoelectric, structural, and acoustic behavior in multilayered domains, and supports anatomically realistic vascular simulations. However, this accuracy faces a trade-off with a considerable computation overhead, long runtimes for large arrays or 3D models, and the absence of built-in imaging functions, such as beamforming. The existing studies reflect these trade-offs; MATLAB analyses typically simplify the piezoelectric layer and tissue conditions, whereas COMSOL is typically used for design optimization, and is not extended to imaging. Thus far, acoustic propagation has not been modeled through a vascular phantom with a flexible PMN-PT 1-3 composite. Furthermore, such modeling has not been linked to a full simulation-to-image pipeline.
Unlike prior approaches that rely solely on parametric scripts or the finite element method (FEM), our framework integrates array optimization, multiphysics wave propagation, and image reconstruction within a closed-loop workflow. The proposed hybrid simulation integrates MATLAB TAC_GUI for rapid array-parameter design with COMSOL for multiphysics modeling. TAC_GUI evaluates the effect of element dimensions on side lobe suppression, focal depth, and beam width, whereas COMSOL helped in simulating ultrasound transmission in layered tissue phantoms, thereby enabling vessel boundary detection through time-of-flight (TOF) analysis. The resulting RF datasets were processed in the MUST using delay-and-sum (DAS) beamforming to enhance the spatial resolution and image contrast. This integrated pipeline presents a systematic foundation for the pre-fabrication and design of the flexible PMN-PT 1-3 arrays. In this study, we focused on simulation to reduce the design uncertainty, minimize prototyping cycles, and lay the groundwork for subsequent phantom and system-level validation.
2. METHODOLOGY
2.1 Ultrasonic beam Simulation of UTAs
The geometric and acoustic properties of individual elements significantly affects the imaging performance of ultrasonic transducer arrays in vascular applications. Among these, the transducer aperture contributes significantly to determining the beam characteristics, such as the penetration depth, beam confinement, and side lobe levels. To optimize these parameters before fabrication, we employed the TAC_GUI toolbox in MATLAB, which enables rapid simulation of the acoustic field profiles in a homogeneous medium [19]. This tool is well suited for the early stage evaluation of transducer array configurations.
In this study, we analyzed the impact of variations in the aperture size on the beam performance of PMN-PT 1-3 composite elements. The proposed UTA was developed for wearable applications, in which optimal acoustic coupling and precise beam control were essential, as shown in Fig 1. We selected four square aperture sizes to represent the practical dimensions of the flexible UTAs: 0.6 mm, 0.9 mm, 1.2 mm, and 1.5 mm. Each transducer element was simulated in a medium comprising an acoustic impedance of 1.6 MRayl. We applied a pulse-echo excitation source, and computed the beam profiles in a 2D x–z domain extending up to 40 mm in depth and ±20 mm laterally.

Demonstration of UTA (a) as a patch, (b) working concept of the UTA with beam penetration, (c) composition of the UTA, and (d) cross-section view of the UTA element in action with echo location of the vessel walls
The key beam characteristics were extracted via post-processing based on the penetration depth and side-lobe profiling. The effective penetration depth was defined as the axial distance at which the pressure field amplitude fell below 10% of its peak value. Furthermore, we analyzed the lateral beam profiles at the focal depth to evaluate the beam width and amplitude of the side lobes. They are both essential indicators of spatial resolution, and help in improving the clarity of the final ultrasound image.
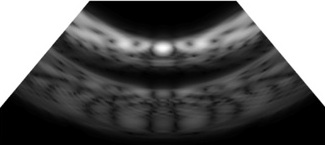
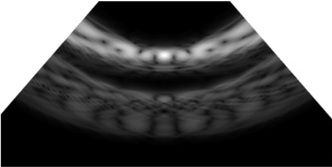
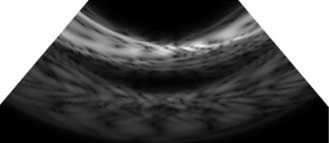
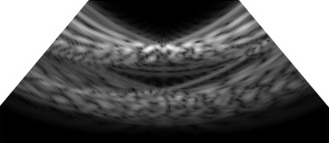
Fig. 2 depicts the normalized beam profiles for all four aperture sizes. As expected, the smallest element with a size of 0.6 mm produced a narrow but shallow beam with minimal side lobes dominated by diffraction effects. Conversely, the largest element with a size of 1.5 mm exhibited deeper penetration, but introduced significant side-lobe energy, which can deteriorate the image quality through off-axis artifacts. The aperture size of 1.2 mm helped in achieving a balance between sufficient penetration and controlled side lobe levels. Therefore, it was selected as the baseline for further finite element modeling in COMSOL.

Acoustic field simulation for 1-3 piezoelectric composites with different sizes (a) 0.6mm x 0.6mm, (b) 0.9mm x 0.9mm, (c) 1.2mm x 1.2mm, (d) 1.5mm x 1.5mm implemented in TAC_GUI toolbox MATLAB
We computed the beam width and side-lobe level for each aperture configuration to quantify these differences; Table 1 summarizes the results. These findings demonstrate the trade-off between the imaging depth and lateral resolution, highlighting the importance of intermediate aperture selection for wearable applications focused on vascular structures located 20–40 mm beneath the skin surface.

Beam characteristics of different apertures
In summary, the TAC_GUI presents an effective and computationally lightweight environment for evaluating the transducer design parameters. Such simulations can accelerate the development cycles and improve the design accuracy without immediate reliance on the physical prototypes.
2.2 Multiphysics Modeling of blood vessel phantom
To evaluate the functional performance of the flexible PMN-PT 1-3 UTA in a biologically relevant environment, we performed a comprehensive multiphysics simulation using COMSOL Multiphysics. This finite element model was designed to replicate ultrasound wave propagation in layered soft tissues containing embedded vascular structures, thereby enabling time-of-flight (TOF)-based echo analysis and vessel diameter estimation. The simulation approach helped in evaluating the acoustic field behavior, echo timing, and structural detectability without requiring physical prototyping.
The simulation domain comprised four primary regions: the flexible UTA model, a coupling layer that represents ultrasound gel, a soft tissue phantom, and an embedded cylindrical vessel. We employed a perfectly matched layer (PML) surrounding these layers to absorb the outgoing waves and eliminate the non-physical boundary reflections. We modeled a 5-element linear transducer array spanning the full width of the target vessel to capture the echo responses from several lateral positions. This configuration ensures complete acoustic coverage across the vessel lumen and closely reflects the practical layout of the fabricated array.
Fig. 3(a) depicts the target vascular phantom (VATA-0705) used in the simulation models, which highlights the location and dimensions of the three target vessels embedded at different depths. Fig. 3(b) depicts a B-mode ultrasound scan of the same phantom captured using a commercial Philips L12-4V probe for experimental comparison. The diameter measured using the commercial probe was 2.7 mm, 3.8 mm, and 6.6 mm The result was used to benchmark the simulation performance. Fig. 3(c) depicts a schematic of the COMSOL simulation geometry, including the UTA placement, tissue layers, vessel structure, and zoomed-in mesh configuration for the transducer elements used for Target Vessel #1.

Phantom model with (a) location of the vessels inside the phantom, (b) imaging of the target vessels performed by L12-4v Phillip commercial transducer scale in (mm), and (c) schematic of the COMSOL simulation model with a zoomed view of the transducer model, depicting the target location and depth.
Fig. 4 depicts the simulated beam profile of the 1-3 composite array in the homogenous tissue phantom. A single UTA element was excited using a pulse-echo signal, defined as V = 20e–t/Tsin(2πft). The tissue and vessel materials were assigned with nearly identical acoustic impedance values of 1.6 MRayl based on the literature [20]. The proposed model was meshed with a quarter-wavelength element size to ensure a sufficient resolution of wave propagation.

Results of the COMSOL FEM based simulation (a) transmission of ultrasound pulse inside a phantom with observable echo and top reflections arriving at the transducer element from the bottom wall with zoomed view on beam propagation, (b) relative intensity measured at a distance away from the center of the transducer.
Fig. 4(a) presents a temporal snapshot of the simulated acoustic pressure field. Fig. 4(a) depicts the ultrasound wave transmitted from the proximal (top) wall of the vessel, which represents the first detectable echo in the pulse-echo scenario. These echoes were clearly distinguishable in the simulation, demonstrating the ability of the model to resolve small-scale discontinuities and the temporal separation between the reflectors. The intensity of the received acoustic waves was measured across the surface of the transducer. The acoustic field had 0.1 peak intensity. This information provides crucial details on the minimum number of transducers required in the design of the acoustic window for target object detection. Fig. 5 depicts the time-domain response captured by the transducer element. The waveform contains three identifiable peaks: the first corresponds to the gel–tissue interface, followed by echoes from the top and bottom vessel walls. For Vessel #1, the reflection times were 9.7 µs and 12.8 µs for the top and bottom walls, presenting an estimated diameter of 2.7 mm. This closely concurs with the physical geometry of the phantom, demonstrating the capacity of the transducer for accurate vascular imaging.

COMSOL output of the ultrasonic pulse-echo signal incident on the virtual vessel phantom and the reflected wave signals from the virtual vessel. (a) complete pulse-echo signal measured across time, (b) pulse-echo signal portion showing only the reflected wave from the vessel walls.
This method was repeated at two additional vessel sites; Table 2 summarizes the results. The estimated diameters for Vessels #2 and #4 were 3.8 mm and 6.6 mm, respectively; both the vessels concur strongly with the known phantom dimensions.
Pulse-echo Time Calculation for the Static Diameter of the Target Vessel
This FEM-based simulation approach presents a detailed analysis of the acoustic interaction, echo timing, and signal propagation. Thus, it provides critical feedback for transducer array design prior to physical fabrication. The combination of realistic phantom modeling and pulse-echo tracking presents a strong foundation for the virtual validation of wearable ultrasonic systems designed for continuous, noninvasive blood pressure monitoring.
In Fig. 5, the diameter of the target vessel was estimated using the pulse-echo data obtained from a single transducer element. This configuration demonstrates that even a single element can help in accurately estimating the diameter based on the time-of-flight (TOF) analysis, provided that the vessel is relatively linear and perpendicular to the acoustic axis. However, in practical scenarios, vascular boundaries are typically curved or angled, which can introduce uncertainties, such as wavefront scattering and angle-dependent refraction at the vessel walls. These effects can cause errors in the echo arrival time and diameter estimation.
To mitigate such limitations and improve robustness across different anatomical geometries, a full-array model was adopted. By incorporating multiple elements, the array formed a complete acoustic window across the vessel, enabling spatial averaging, improved lateral sampling, and enhanced beamforming capability. This multi-element approach reduces the impact of the curvature-related distortions and supports more reliable diameter measurements in complex vascular environments.
In ultrasonic imaging systems, beamforming contributes significantly to enhancing the spatial resolution and image fidelity by steering and concentrating the acoustic energy towards a desired focal region. For linear one-dimensional (1D) transducer arrays, axial focusing is typically achieved by applying calculated time delays to the excitation signals of the individual elements [21]. These delays synchronize the emitted wavefronts, thereby enabling constructive interference at a specified depth along the central axis of the array.
Axial focusing primarily involves aligning the phase fronts of the acoustic waves emitted by the individual transducer elements such that they converge coherently at a focal point located at a depth of (zf) directly in front of the array. Fig. 6 depicts the geometry of the problem, where a linear 1D array is placed along the x-axis and the focal point lies along the z-axis at (xf = 0 , zf = 0 ). Each element in the array can be identified by its index (n) and its position is given by (xn = n. d), where (d) denotes the inter-element spacing (pitch). The central element, indexed by (n = 0 ) was assumed to lie at the origin (0, 0).

Geometrical parameters for focusing the ultrasound array across Z-axis at the target point
The acoustic wave emitted by each element travels a different distance from the focal point, owing to the variation in the lateral positions of the elements. For the (nth ) element located at (xn ), the Euclidean distance to the focal point at (0, zf) is given as:
| (1) |
For Eq. (1), based on the speed of sound in the propagation medium (c), the time required for the acoustic wave from the (nth ) element to reach the focal point is given as:
| (2) |
Because the outer elements (n = 1 and n = 5) have longer travel paths, the signals emitted from these elements must be initiated earlier than those positioned closer to the center. To ensure that all the wavefronts arrive at the focal point simultaneously, time delays were introduced into the excitation signals, as shown in Eq. (2). The reference time (tref) was set as the travel time of the central element (which follows the shortest path to the focus), that is, (). Subsequently, the relative time delay for the (nth ) element is given by:
| (3) |
These time delays were implemented electronically during transmission and reversed during reception to enable a phase-aligned signal summation. This technique, typically referred to as the time delay law, forms the basis for transmitting and receiving beamforming.
To evaluate the impact of beamforming on imaging performance, we conducted simulations in COMSOL Multiphysics using a 5-element linear UTA based on the information in Fig. 4(b). Beam focusing was applied at a depth of 7.3 mm, corresponding to the top wall of Vessel #1, as shown in Fig. 3(a). We compared the focused and unfocused scenarios in terms of the acoustic field distribution and point spread function (PSF).
In the unfocused case, all the transducer elements were excited simultaneously with no delay applied. This configuration presented a dispersed acoustic field with a broader beamwidth and reduced spatial coherence, as shown in Fig. 7. Fig. 8 depicts the corresponding PSF, which exhibited a wide main lobe with multiple high-magnitude side lobes, indicating poor lateral resolution and susceptibility to off-axis signal interference. These beam characteristics were effective for initial scanning or broad coverage, but were suboptimal for high-precision imaging tasks.

Transmission of the unfocused ultrasound pulse and reflected pulse-echo waveform with zoom view on beam natural focus

Measurement of the Point Spread Function across the top wall of the artery
Conversely, focused configuration applied the calculated delays to each element, presenting a convergent wavefront at the designated focal depth. Fig. 9(a) depicts the resultant pressure field, where the energy is tightly confined to the vessel interface. The focused PSF presents a narrow main lobe and significantly reduced side lobe amplitude, demonstrating improved lateral resolution and image sharpness, as shown in Fig. 10. Quantitatively, the peak pressure at the focal point increased from 1.2 kPa in the unfocused case to 4.3 kPa in the focused case. This presented a considerable improvement in the acoustic intensity and spatial concentration.

Pulse-echo response results from the focused beam (a) focused transmission beam on the top phantom wall vessel with normalized intensity and zoom view on beam focus point, (b) overall pulse-echo profile obtained from the 1D transducer array elements, (c) zoom view of the reflected pulse-echo

Measurement of the Point Spread Function across the top wall of the artery with a focused beam with normalized pressure magnitude and compared with an unfocused transmission beam
Although focused beamforming presents significant advantages in terms of the resolution and energy efficiency, it introduces several complexities. This process requires accurate delay calculation, precise synchronization of the transducer signals, and more computational resources, particularly in real-time imaging. Furthermore, the focusing performance is sensitive to medium inhomogeneities and element misalignments, which may deteriorate the coherence of the beam during practical implementation. consequently, estimating the diameter solely using the pulse-echo response can cause errors and false readings, as shown in Fig. 9(b) and (c). Hence, a method is required to clarify the beam delay process in developing B-mode imaging.
Despite these challenges, the results indicated that delay-based focusing drastically improves the signal fidelity, particularly when applied to layered biological media, such as vascular tissues, as a narrow beam with minimal side lobes was observed. The enhanced PSF and intensity concentration achieved through beamforming enable its integration into flexible UTAs designed for wearable, high-resolution vascular monitoring systems. In the next section, we focus on the utilization of COMSOL signals to obtain a B-mode image and then compare the overall array performance.
3. B-MODE IMAGE RECONSTRUCTION
DAS beamforming is a foundational technique that has been widely employed in medical ultrasound imaging. DAS is one of the simplest and most robust beamforming algorithms; it involves aligning the echo signals received from multiple transducer elements based on the estimated propagation delays. These signals were then summed to enhance the signals obtained from a specific spatial location. The principle of DAS originated in radar and telecommunications applications, where antenna arrays were used to focus energy along specific directions. In ultrasound imaging, DAS serves as the primary method for reconstructing the B-mode and Doppler images from raw RF or I/Q data owing to its straightforward implementation and compatibility with real-time imaging. In this study, the RF scan obtained from COMSOL was employed in the MUST model to obtain the B-Mode images [22].
Despite its simplicity, the signal timing, wave propagation models, and array geometry must be carefully considered for the accurate implementation of DAS. This process includes computing the round-trip travel times from the transducer to the tissue scatterers and back, selecting the appropriate receiver apertures to optimize the resolution, and applying the appropriate interpolation and demodulation techniques. In this study, we focused on two core aspects of the DAS process: (1) the computation of the time delays and the summation strategy for RF signals, and (2) beamforming using complex I/Q signals with adaptive aperture tuning using the f-number principles.

Overview of the B-mode imaging process in MUST Toolbox
3.1 Time-of-Flight computation and fundamental DAS formulation
In the beamforming workflow, the first critical stage involves the accurate computation of the TOF for each transmit–receive path. The simulated acoustic field data generated in COMSOL comprised the spatial coordinates of each transducer element and the target medium. Based on this geometric information, the TOF was determined by calculating the round-trip travel distance between each element and imaging point divided by the assumed constant speed of sound in the modeled medium. This calculation presents a unique delay value for each element–pixel pair, thereby ensuring that the signals originating from the same spatial location are temporally aligned. Accurately estimating the TOF is essential as even minimal timing errors can cause focal blurring, deteriorated lateral resolution, and reduced contrast.
The fundamental DAS formulation was applied after achieving the TOF values. In DAS, each received channel signal was shifted in time based on its computed delay, and the aligned waveforms were coherently summed across the array aperture. This summation reinforced the constructive interference of the signals received from the focal point while suppressing the off-axis contributions and side lobe artifacts. In our implementation, the summation process was performed on the in-phase/quadrature (I/Q) baseband data rather than the raw RF data to enable efficient phase manipulation and reduce the sampling requirements. Following the coherent summation, the envelope of the beamformed data was extracted using the Hilbert transform, log-compressed to manage the dynamic range, and then mapped to grayscale to obtain the final B-mode image. This combined TOF computation and DAS processing forms the core of the image reconstruction pipeline, thereby directly linking the multiphysics simulation output obtained from COMSOL to the high-resolution ultrasound image synthesis in MATLAB.
3.2 B-mode imaging simulation
In this section, we present the imaging results obtained using the MUST toolbox following the comprehensive analysis of the beamforming algorithms and signal processing strategies described in the previous section. We applied DAS beamforming to the simulated radiofrequency (RF) data to reconstruct the B-mode ultrasound images, enabling a comprehensive evaluation of the beam characteristics and image quality presented by the selected transducer configurations.
The reconstructed B-mode images present valuable insights into the key imaging performance metrics, such as the lateral resolution, beam symmetry, and focal depth. The efficacy of the focusing strategy was evaluated based on the visual sharpness and delineation of the structural features within the images. Additional factors, such as the uniformity of the intensity, contrast variations, and the presence of side lobes or noise artifacts, were also analyzed to determine the overall fidelity of the beamformed output. In particular, we focused on the relationship between the array design parameters, including the pitch size and aperture, and their impact on the image quality.
Fig. 12(a) depicts the B-mode reconstruction achieved with a pitch of λ/2, where the acoustic energy was focused at the vessel boundary, presenting a high-intensity main lobe with minimal side lobe interference. This configuration yields a clean PSF that enabled precise wall localization and reduced the off-axis clutter. The focused beam presented consistent brightness along the lumen edges and maintained sharp delineation even in the deeper regions of the field of view, thereby supporting high-resolution imaging. The suppression of the side lobes prevents spurious echoes from overlapping the vessel boundary, which helped in improving the contrast-to-noise ratio and spatial definition. Conversely, Fig. 12(b) exhibits a broader main lobe and visible off-axis features consistent with grating-lobe artifacts with a pitch of 3λ, which reduce the clarity of the vessel wall and introduce a bright speckle away from the focal zone. Although both the configurations can localize the lumen, the pitch of λ/2 presents superior focusing and off-axis suppression, demonstrating its effectiveness in achieving optimal lateral resolution and minimizing the imaging artifacts in vascular ultrasound.

B-Mode imaging performed for Vessel # 1 for the case of pitch size (a) λ/2 and (b) 3λ
This results in a wider main lobe and elevated side lobes, impairing the lateral resolution and increasing the noise levels around the vessel boundary. The reduced focusing precision demonstrates the limitations presented by the larger element spacing on the beam steering and image quality. Table 3 presents a comparative analysis of the B-mode images reconstructed using varying pitch sizes ranging from λ/2 to 3λ, particularly for Target Vessel #1. The image quality deteriorated significantly with an increase in the pitch size, which was primarily attributed to the enhanced diffraction effects and elevated side lobe levels. The data indicated that a finer pitch (λ/2) enabled sharper focusing, better lateral resolution, and reduced off-axis artifacts. Conversely, larger pitch values caused beam spreading, decreased resolution, and more pronounced noise. This comparison demonstrates the significant influence of the array pitch on the image fidelity and beamforming effectiveness in ultrasound imaging.
B-mode Imaging Performance with Varying Pitch Sizes for Target Vessel #1
The comprehensive analysis of the beamforming strategies and the corresponding imaging results demonstrated that the transducer design parameters contributed significantly to the image quality. Based on these insights, the fabrication of a full prototype of the ultrasonic array was the next logical step. This prototype incorporated key design improvements, such as the expansion of the aperture area based on a higher element count and implementation of refined pitch reduction techniques to further enhance the lateral resolution and focusing accuracy. These optimizations helped in achieving superior image fidelity, there contributing to the development of more robust and clinically relevant ultrasound imaging systems.
In this study, we achieved considerable progress in simulating and evaluating flexible UTAs for superficial vascular imaging. However, the analysis of the imaging performance for blood vessels located deeper within the skin, such as the carotid artery, remains beyond the scope of the current work. The findings of this study present considerable potential for future research. In the subsequent stages, we aim to conduct advanced simulation studies to evaluate the imaging performance at greater depths. Thus, we aim to incorporate more realistic anatomical models and curved sensor geometries that better mimic the surface of the skin. Furthermore, we aim to experimentally validate these designs using multilayer vascular phantoms with varying vessel diameters and depths post-fabrication to evaluate their realworld applicability. Future works must include the testing of the fabricated flexible PMN-PT 1-3 composite on a multilayer tissue-mimicking VATA-0705 phantom using a Verasonics Vantage system. The validation process involves pulse-echo, beam profile, and B-mode imaging measurements, with key parameters such as lateral resolution, signal-to-noise ratio, and phantom vessel diameter estimation accuracy, which must be compared directly with the simulation predictions to demonstrate the model fidelity.
4. CONCLUSIONS
In this study, we proposed a simulation-driven approach for evaluating flexible PMN-PT 1-3 UTAs for noninvasive vascular monitoring. Using MATLAB and COMSOL, we demonstrated that a single transducer element can accurately estimate the diameters of a vessel, as demonstrated using a vessel with a diameter of 2.7 mm at a depth of 7.3 mm using TOF analysis. Expanding to a full array enables delay-based beamforming, presenting improved lateral resolution and an increase in the peak pressure from 1.2 kPa for unfocused beam transmission to 4.3 kPa for focused beam transmission. B-mode imaging, which was achieved using the MUST toolbox, demonstrated that a pitch of λ/2 produced well-focused images with minimal side lobes and clear vessel boundaries, demonstrating the benefits of dense element spacing for the image quality. Overall, this study demonstrated the advantages of both single and array-based flexible UTAs in vascular imaging. Deep vessel imaging and curved skin surfaces present considerable potential for future research and for extended simulation and device testing. In this study, we focused on simulation as a stand-alone contribution. By integrating TAC_GUI, COMSOL Multiphysics, and MUST beamforming into a unified workflow, we presented a numerical framework that reduced the uncertainty before fabrication. This study serves as a foundation for our ongoing fabrication efforts, and we aim to experimentally validate the simulation predictions through phantom testing and in-vitro studies using the Verasonics Vantage system. The validation process involved pulse-echo, beam profile, and B-mode imaging measurements, with key parameters such as the lateral resolution, signal-to-noise ratio, and vessel diameter estimation accuracy, compared directly with the simulation predictions to confirm model fidelity.
Acknowledgments
This work was supported by the Human Plus Convergence R&D Program (NB2740) funded by the National Research Foundation of Korea; the Technology Innovation Program (MT7200, RS-2024-00468747) funded by the Ministry of Trade, Industry & Energy (MOTIE, Korea).
REFERENCES
-
Global Cardiovascular Risk Consortium, Global effect of modifiable risk factors on cardiovascular disease and mortality, N. Engl. J. Med. 389 (2023) 1273–1285.
[https://doi.org/10.1056/NEJMoa2206916]

-
T. Le, F. Ellington, T.Y. Lee, K. Vo, M. Khine, S.K. Krishnan, et al., Continuous non-invasive blood pressure monitoring: a methodological review on measurement techniques, IEEE Access 8 (2020) 212478–212498.
[https://doi.org/10.1109/ACCESS.2020.3040257]
- S.R.M. Mansouri, A Novel Approach for Cuff-less and Continuous Blood Pressure Monitoring Using Deep Learning Networks, Ph.D. thesis, Auckland University of Technology, New Zealand, 2020.
-
T.G. La, L.H. Le, Flexible and wearable ultrasound device for medical applications: A review on materials, structural designs, and current challenges, Adv. Mater. Technol. 7 (2022) 2100798.
[https://doi.org/10.1002/admt.202100798]
-
X. Xue, H. Wu, Q. Cai, M. Chen, S. Moon, Z. Huang, et al., Flexible ultrasonic transducers for wearable biomedical applications: A review on advanced materials, structural designs, and future prospects, IEEE Trans. Ultrason. Ferroelectr. Freq. Control 71 (2023) 786–810.
[https://doi.org/10.1109/TUFFC.2023.3333318]
- W. Du, Piezoelectric single crystal based one-dimensional phased array for breast tissue imaging, Ph.D. thesis, Massachusetts Institute of Technology(MIT), USA, 2024.
-
D. Arora, D. Kaur, Magnetically and electrically tunable Pb(Mg1/3Nb2/3)O3–PbTiO3/ferromagnetic shape memory alloy nanolayered film-based acoustic wave resonator for flexible microelectromechanical systems, ACS Appl. Nano Mater. 7 (2024) 22453–22462.
[https://doi.org/10.1021/acsanm.4c01465]
-
A. Kumar, P.S. De, A. Roy, Revisiting lead magnesium niobate-lead titanate piezoceramics for low-frequency mechanical vibration-based energy harvesting, J. Alloys Compd. 945 (2023) 169298.
[https://doi.org/10.1016/j.jallcom.2023.169298]
- A.D. Ciubotariu, Design, Modeling, Fabrication and Control of PMN-PT Piezoelectric Systems, Ph.D. thesis, Université de Franche-Comté, France, 2016.
-
V.T. Rathod, A review of acoustic impedance matching techniques for piezoelectric sensors and transducers, Sensors 20 (2020) 4051.
[https://doi.org/10.3390/s20144051]
-
C. Liu, H. Sun, J. Ren, H. Cheng, M. Xie, Y. Liu, Design and optimization of flexible and stretchable ultrasonic transducer array for arterial blood pressure monitoring, IEEE Sensors J. 24 (2024) 15055–15064.
[https://doi.org/10.1109/JSEN.2024.3375915]
- COMSOL, Angle Beam Nondestructive Testing. https://www.comsol.com/model/angle-beam-nondestructive-testing-78811, , 2019 (Accessed 24 July 2025).
- COMSOL, Modeling piezoelectric devices as both transmitters and receivers. https://www.comsol.com/model/modeling-piezoelectric-devices-as-both-transmitters-and-receivers-71111, , 2018 (Accessed 23 June 2025).
-
S.J. Park, M.G. Shin, N.Y. Kim, S.H. Lee, Development of PDMS-based drag force-type flowmeter with graphite–CNT composite as piezoresistive material, J. Sens. Sci. Technol. 32 (2023) 44–50.
[https://doi.org/10.46670/JSST.2023.32.1.44]
-
Y. Min, Y. Kim, J. Kim, S. Seo, H.J. Kim, Highly flexible piezoelectric tactile sensor based on PZT/epoxy nanocomposite for texture recognition, J. Sens. Sci. Technol. 32 (2023) 88–94.
[https://doi.org/10.46670/JSST.2023.32.2.88]
-
M. Qu, X. Chen, K. Zhu, X. Guo, J. Xie, Beam-membrane coupled piezoelectric micromachined ultrasonic transducers with enhanced transmitting sensitivity, Micromachines 13 (2022) 423.
[https://doi.org/10.3390/mi13030423]
-
V. Ostasevicius, V. Jurenas, S. Mikuckyte, J. Vezys, E. Stankevicius, A. Bubulis, et al., Development of a low-frequency piezoelectric ultrasonic transducer for biological tissue sonication, Sensors 23 (2023) 3608.
[https://doi.org/10.3390/s23073608]
-
H. Kim, X. Jiang, Numerical study of a miniaturized, 1–3 piezoelectric composite focused ultrasound transducer, Appl. Sci. 13 (2023) 615.
[https://doi.org/10.3390/app13010615]
- B. Kohout, Transducer Array Calculation (TAC) GUI. https://www.mathworks.com/matlabcentral/fileexchange/35657-transducer-array-calculation-tac-gui, , 2025 (Accessed 17 Jun 2025).
-
M. Rynkiewicz, T. Rynkiewicz, Bioelectrical impedance analysis of body composition and muscle mass distribution in advanced kayakers, Hum. Mov. 11 (2010) 11–16.
[https://doi.org/10.2478/v10038-010-0008-0]
-
L.W. Schmerr Jr., Fundamentals of ultrasonic phased arrays, Mod. Phys. Lett. B 22 (2008) 917–921.
[https://doi.org/10.1142/S0217984908015607]
-
D. Garcia, Make the most of MUST, an open-source MATLAB UltraSound Toolbox, Proceedings of 2021 IEEE International Ultrasonics Symposium (IUS), Xi'an, China, 2021, pp. 1–4.
[https://doi.org/10.1109/IUS52206.2021.9593605]