
Vulnerability Detection in Unmanned Aerial Vehicle via Structural Skeleton Inference with RGB-to-IR Transfer Learning

ⓒ The Korean Sensors Society
This is an Open Access article distributed under the terms of the Creative Commons Attribution Non-Commercial License (https://creativecommons.org/licenses/by-nc/3.0/) which permits unrestricted non-commercial use, distribution, and reproduction in any medium, provided the original work is properly cited.
Abstract
This study proposes a skeleton-guided vulnerability detection method to neutralize the asymmetric threat of Unmanned Aerial Vehicles (UAVs). While traditional bounding-box methods focus solely on target localization, they overlook specific impact points required for maximum neutralization. To address this, the proposed system introduces an implicit graph-skeleton approach that models the target as interconnected nodes to estimate key vulnerability coordinates, enabling a more robust analysis of impact points. To sustain this structural estimation against the severe shortage of labeled infrared data, an RGB-to-IR transfer learning strategy is employed, allowing the network to leverage rich geometric features derived from the visible domain. This approach effectively circumvents data scarcity and ensures reliable operation in challenging infrared environments without performance degradation. Experimental results demonstrate that our approach achieves highly robust, physically consistent, and precise vulnerability detection across heterogeneous multi-sensor datasets.
Keywords:
Vulnerability detection, Skeleton inference, Geometric constraint, Keypoint regression, Transfer learning1. INTRODUCTION
Recently, with the emergence of low-cost Unmanned Aerial Vehicles (UAVs) capable of executing missions ranging from reconnaissance to critical infrastructure strikes, UAVs have surfaced as a prominent asymmetric threat in modern warfare. Consequently, enhancing neutralization efficiency has become imperative for rapid UAV interdiction using weapon systems that range from traditional ammunition-based systems to laser weapon systems [1], which have recently gained significant attention due to their high precision and cost-effectiveness. Under constraints of limited time and firepower resources, maximizing neutralization efficiency necessitates a strategic approach that identifies the structural vulnerabilities of the target and executes precise strikes.
To address this need, this study proposes the Skeleton-Guided Vulnerability Detection Network (SG-VDNet), moving beyond the scope of traditional computer vision research in counter-UAV systems that focused predominantly on target localization. SG-VDNet leverages a skeleton inference framework that inherently captures the interconnected relationships among the key structural components of a UAV. By detecting vulnerabilities based on an understanding of the aircraft's mechanical architecture, the system enforces predefined structural constraints through a novel Structural Geometric Loss (SGL). This loss regularizes the network to actively internalize the organic topology and physical correlations of the UAV directly within its trained weights. Consequently, the system guarantees robust detection performance even under image degradation caused by external environmental factors, such as motion blur from high-speed maneuvers or illumination variations. This implicit graph-skeleton approach provides exceptional extensibility, allowing operators to flexibly reconfigure target impact points depending on operational requirements without necessitating a full retraining of the model.
In addition, to ensure operational capabilities under visibility-limited conditions—such as nighttime or haze—this study extends the system's applicability to infrared (IR) imagery alongside visible (RGB) videos. However, practical constraints exist for IR imagery, as it exhibits blurred boundaries and lower information density compared to RGB images. Moreover, acquiring large-scale, precisely annotated training datasets for IR remains a critical challenge. To overcome these limitations, we adopt an RGB-to-IR transfer learning [2] strategy that transfers the structural feature representations learned from data-abundant RGB imagery to the training phase of the IR domain. Through this approach, we experimentally demonstrate that the system achieves superior vulnerability detection performance in data-scarce environments compared to training from scratch.
2. EXPERIMENTAL
2.1 Related Work and Technical Background
In the initial phase of this study, we evaluated the feasibility of a UAV vulnerability detection methodology using Oriented FAST and Rotated BRIEF (ORB) [3], a widely recognized algorithm that extracts image keypoints based on local intensity gradients. To implement this, an offline database was constructed by extracting ORB descriptors from the critical vulnerability locations of various UAV models. For an incoming input frame, descriptors extracted from the target were matched against this pre-built database, estimating the point with the highest similarity as the target's vulnerability coordinate. While this approach functioned as intended during preliminary experiments involving sequential, highly controlled frames, significant performance degradation surfaced in realistic operational environments due to several critical limitations.
Because this pixel-level matching scheme relies exclusively on local intensity patterns, it is highly susceptible to variations in the UAV’s flight attitude or ambient illumination. Under such conditions, the algorithm often misidentifies identical structures as completely distinct points or suffers from perceptual ambiguity with similar texture patterns. As illustrated in the qualitative results in Fig. 1, the keypoints at the designated vulnerability locations frequently failed to be extracted consistently, leading the system to misidentify irrelevant regions with similar intensity values as the target vulnerability point.
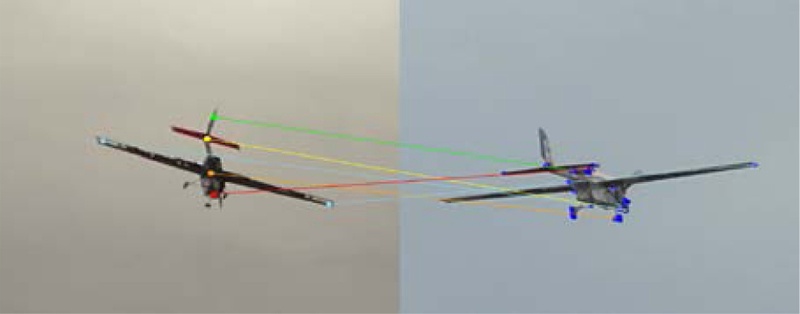
False matching caused by the failure to extract proper ORB keypoints.
To mitigate this keypoint drop-out issue, increasing the threshold for the number of extracted keypoints was considered. However, as demonstrated in Fig. 2, while this successfully captured the target descriptors, it simultaneously extracted numerous noisy keypoints from complex background clutter and repetitive structural textures on the aircraft hull. As a result, this drastically elevated the false-match rate. These experimental findings firmly indicate that localized, low-level feature matching possesses fundamental limitations in stably tracking UAV vulnerability coordinates within complex, real-world flight environments.
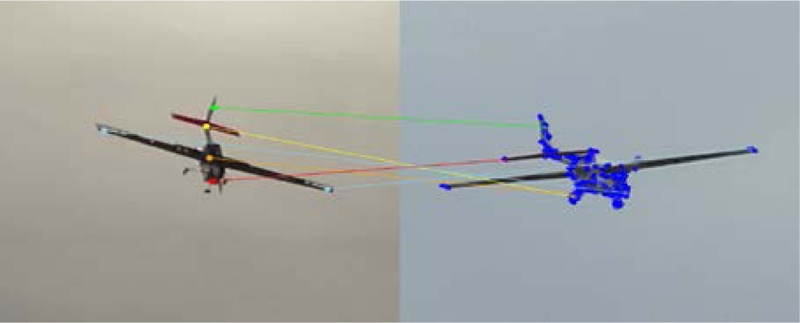
Matching failure resulting from an increased number of feature points.
Aiming to overcome the inherent constraints of classical feature-based matching, we designed the Point-Guided Vulnerability Detection Network (PG-VDNet) as a comparative baseline. This architecture is inspired by standard deep learning-based keypoint regression and top-down human pose estimation frameworks [4,5], focusing on detecting critical vulnerability locations on a UAV hull. To improve upon the structural limitations of single-point prediction methods that rely exclusively on localized features around the target point, we modeled the target coordinates using Gaussian probability distribution heatmaps [6] instead of direct coordinate regression, allowing the network to infer target points through localized region-wide comparisons. By executing data-driven extraction at the region level, we confirmed that the detection stability under varying illumination and flight attitudes improved compared to classical approaches.
However, this learning scheme still exposed fundamental vulnerabilities because it relies solely on the visual similarity of localized regions without understanding the overall semantic context of the UAV’s structural architecture. The qualitative results of this limitation are presented in Fig. 3. While the model successfully localizes the vulnerability points under standard operational scenarios (Fig. 3(a)), its prediction error spikes drastically in degraded or low-resolution environments where visual features become blurred and ambiguous (Fig. 3(b)). Furthermore, this framework suffers from a critical lack of operational flexibility. When mission requirements shift, such as during the definition of new target vulnerability points or the modification of existing ones, the pretrained network cannot adapt flexibly and demands a full retraining from scratch. These collective limitations served as the core motivation for this study to propose a skeleton-based vulnerability detection methodology that defines the topological relationships between key UAV components and enforces geometric constraints during training to achieve superior robustness.
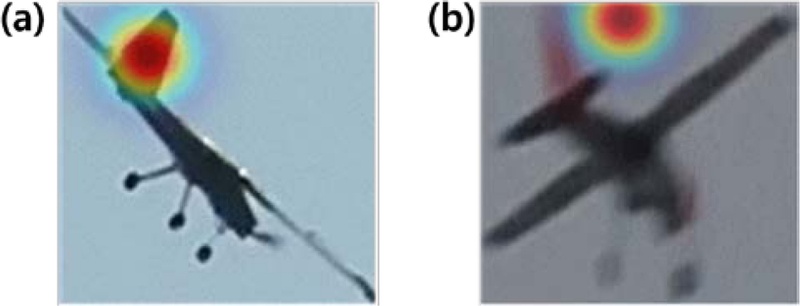
Vulnerability (Tail Unit) detection results. (a) Successful detection. (b) Inaccurate detection with misplaced Gaussian heatmap by image degradation.
2.2 Main Methods
The vulnerability detection network for UAVs operating in both RGB and IR environments was designed through the following steps. First, the core structural points of the UAV and their interconnections were defined as a skeletal structure graph, and a dataset for training was constructed by labeling this graph. Second, an integrated deep learning system was designed to infer the vulnerabilities of UAVs within images in real time, which was then trained using the previously constructed dataset. Because it is difficult to directly infer an object's structure from an entire image, a sequential detection framework was adopted by placing an object-detection network at the front end, thereby enabling the skeletal structure to be extracted exclusively within the detected object region. Finally, to guarantee performance in the IR domain where obtaining labeled data is challenging, an RGB-to-IR transfer learning pipeline was established.
2.2.1.1. Definition of Vulnerability Nodes
In this study, to maximize the precision strike performance against UAVs, a total of six core components including the head, body, left and right wings, tail joint, and tail unit were defined as candidate vulnerability nodes. The selection of each node was based on structural universality, ensuring that it is not limited to a specific aircraft type but is commonly shared across multiple UAV models, as well as neutralization efficiency, focusing on the capability to induce the loss of flight control and physical destruction of the aircraft upon impact.
2.2.1.2 Formulation of Edges and Skeletal Structure Graph
The defined nodes are connected by edges according to the actual structure of the aircraft, forming a single skeletal structure graph that combines a main axis running through the head-body-tail and a transverse axis connecting the body to the left and right wings. By reflecting this topological structure during the training process as a strong geometric constraint on the relative angles between nodes, the model is able to maintain the consistency of the entire skeleton and logically infer missing coordinates, even in situations where the target rotates or certain parts are occluded. Fig. 4(a) visualizes the original image and its corresponding vulnerability nodes and their interconnections on Fig. 4(b) as a single skeletal structure graph.
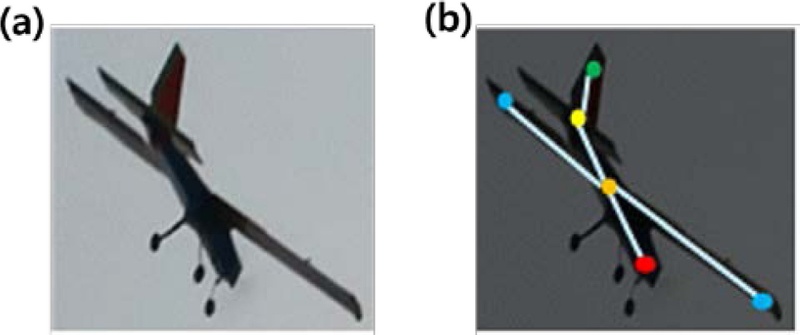
Example of the proposed skeletal structure graph. (a) original input image. (b) corresponding skeletal structure graph.
The UAV vulnerability detection network largely consists of two main components: a target area detection network and a vulnerability extraction network. The latter includes a post-processing stage that infers the skeletal structure within the extracted target area, identifies the locations of vulnerabilities based on this structure, and converts them into coordinates on the original image as illustrated in the diagram of Fig. 5.
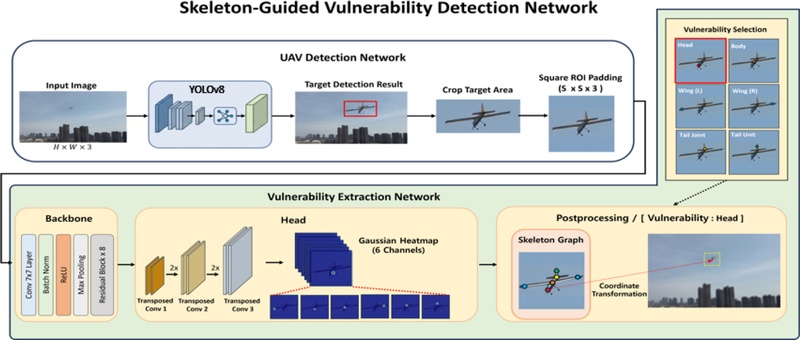
Overall Framework of Skeleton-Guided Vulnerability Detection Network.
2.2.2.1 UAV Detection Network
To precisely isolate only the UAV from the complex background of the input image, YOLO v8 (You Only Look Once version 8) [7,8] was utilized. Receiving the image containing the UAV as an input, it extracts a bounding box of the UAV shape and applies padding similar to the background color around the edges to generate an output image of a uniform square size. The generated output image is then fed as an input into the skeletal structure inference network, serving to minimize noise caused by the background and maximize computational efficiency.
2.2.2.2 Vulnerability Extraction Network
A network was designed to infer, from the UAV region extraction in Section 2.2.2.1, the six vulnerability points and their interconnecting skeletal structure according to the aircraft’s anatomy. The network consists of a backbone part that extracts key feature portions from the input image and compresses them into a feature map, a head part that extracts a Gaussian heatmap for each core point from the feature map, and a post-processing part that connects these points to generate a skeletal structure graph and ultimately converts them into image coordinates of the vulnerabilities.
First, the backbone is designed based on ResNet-18 [9], which extracts and compresses features from the overall geometry of the UAV into a low-resolution feature map. This learning-based initial feature extraction serves as a foundation that enables the network to stably capture the positions of the target's major vulnerabilities, even during transfer learning to a low-resolution IR image domain.
Subsequently, the compressed low-resolution feature map is progressively expanded and restored to a higher resolution in the head part, which transforms it into a final six-channel Gaussian heatmap through three stages of transposed convolution layers [10,11]. The Gaussian heatmap generated at this stage represents the probability distribution of a specific pixel being each node, thereby offering faster training convergence and superior performance compared to simple coordinate regression methods. Although the six node channels share the common feature map extracted from the backbone and are derived in parallel, they do not merely predict individual positions. Instead, they additionally receive the predefined geometric constraints via the loss function. As the loss function enforces physical correlation among the nodes, the network actively internalizes the interconnections and structural constraints between channels within its weights. Consequently, based on the information of visible nodes, the model deduces the locations of occluded nodes not by simple estimation, but based on the logic of the learned skeletal structure.
In the post-processing part, coordinates are extracted from the obtained Gaussian heatmap and combined into a graph structure using an adjacency matrix. Finally, the network returns the resulting values where the coordinates of each node are calibrated to the actual spatial coordinates. Based on this architecture, operators can selectively designate specific nodes among the predefined core components as target vulnerabilities depending on their operational mission or tactical priorities.
2.2.2.3 Training Strategy and Loss Function
To enhance the generalization performance of the model and ensure robustness across diverse flight environments, a composite loss function that incorporates the physical characteristics of the UAV was designed and applied to the training. The final loss function (Ltotal) is defined as a weighted sum of the heatmap loss (Lhm) for coordinate estimation precision and the SGL (Lsg) for maintaining the physical topological structure, which can be expressed as follows:
| (1) |
In this study, the hyperparameter λ in Eq. (1) was empirically set to 0.1 to balance the convergence scales of both loss terms during the training phase. The heatmap loss is based on the mean squared error between the N predicted heatmaps (Hpred) and the ground-truth heatmaps (Hgt), and a visibility mask M was introduced to cope with situations involving partial occlusion or field-of-view departure. By blocking the errors of unlabeled points from being reflected in the backpropagation through masking, the convergence stability was improved, which can be formulated as follows:
| (2) |
Furthermore, the SGL function enforces the physical validity of the inference results by considering two constraints for the main and transverse axes. First, based on physical structural analysis, the body center (Pb) must be located behind the head (Ph) and the tail unit (pt) must be located behind the body center along the main axis, and both wings (PwL, PwR) must extend in opposite directions relative to the body center. On the image coordinate system, each vector originating from the body center toward the head, tail unit, left wing, and right wing is defined as follows:
| (3) |
| (4) |
In a normal aircraft anatomy, the body longitudinal vector pair (, ) and the wing transverse vector pair () must point in opposite directions relative to each other, meaning that the dot product of each pair should remain negative. If the dot product yields a positive value, it is determined that a structural violation has occurred—such as the airframe being bent or both wings skewed and overlapping to one side—and a penalty is imposed. To this end, the SGL function (Lsg) was designed as follows:
| (5) |
The design of this loss function guides the network to correctly comprehend the overall geometry of the UAV rather than merely predicting coordinates. As a result, it serves to guarantee the physical reliability of the final output skeletal structure graph, even in the IR domain where labeled data is sparse.
Although IR imagery provides significant advantages for target detection at night and under adverse weather conditions, it inherently suffers from lower spatial resolution and sparser texture information compared to standard RGB imagery. This domain-specific discrepancy makes it exceptionally challenging for conventional networks to capture the fine-grained, localized features that are essential for precise vulnerability detection. Furthermore, constructing a high-quality IR dataset is notoriously difficult due to the ambiguity of thermal boundaries, resulting in a severe scarcity of accurately labeled training data in the IR domain. To bridge this cross-domain gap efficiently without requiring an excessive amount of labeled data, this study adopts a targeted transfer learning strategy. Rather than initiating the training process from scratch, we strategically utilize the network weights pretrained on a large-scale RGB UAV dataset as the foundational initial values. During the subsequent training process on the IR dataset, the weights of the backbone network responsible for extracting general geometric attributes, such as edge profiles and global shape contours, are strictly frozen. Fine-tuning is then focused exclusively on the task-specific head and higher-level layers that are dedicated to generating vulnerability heatmaps and reconstructing the intricate skeletal structure. Consequently, the common geometric shapes and inherent topological structures of UAVs already captured by the backbone serve as robust structural priors across domains. This targeted optimization approach prevents the destruction of generalized features while effectively tailoring higher layers to IR characteristics, ultimately allowing the network to converge rapidly and achieve high inference precision even with a limited amount of IR training data.
3. RESULTS AND DISCUSSIONS
3.1. Dataset Composition and Experimental Setup
In this study, the MMFW-UAV [12] dataset was utilized to validate the UAV detection performance in a multi-modal environment. This dataset consists of data on six distinct UAV models with varying physical characteristics and provides paired RGB and IR channel image data along with precise bounding box annotations for all targets. To faithfully replicate an operational environment where an air defense system captures aerial threat targets from the ground, only images captured from a bottom-up viewpoint were selected and used in this experiment. Regarding IR imagery, low-quality data in which the skeletal structure is difficult to discern even with the naked eye due to blurred heat distribution from sensor characteristics or heavy background noise was completely excluded from the training set, as it could hinder model convergence and degrade inference reliability. For the selected images, the UAV target regions were isolated based on the provided bounding box labels, and the vulnerability nodes alongside their structural interconnections were manually labeled for vulnerability detection training.
To validate performance, the test set was first classified into RGB and IR modes depending on the acquisition sensor, and then further subdivided into Easy and Hard groups based on the degree of target deformation and image quality. Furthermore, since an effective strike in an actual air defense scenario occurs within a region encompassing the aircraft's structural vulnerabilities rather than at a single mathematical point, evaluating performance solely through coordinate-to-coordinate comparisons poses limitations. Therefore, to evaluate the vulnerability detection performance based on the distance from the effective vulnerability areas, the aircraft was segmented into region units centered around the predefined skeletal structure nodes. As illustrated in Fig. 6, this process involved utilizing the original target images shown in Fig. 6(a) to concurrently perform semantic region mask labeling for each core component, resulting in the annotated region masks presented in Fig. 6(b).
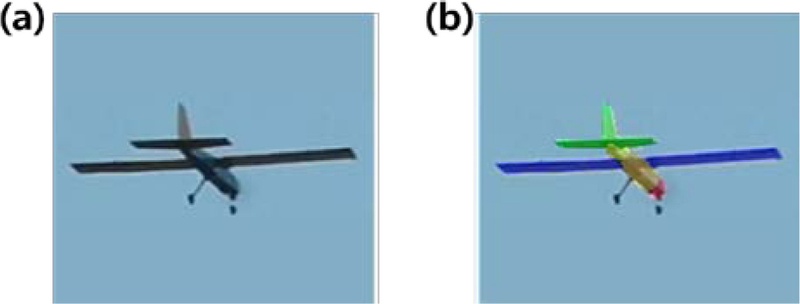
Semantic masking configuration for evaluation dataset. (a) original image. (b) semantic masked image.
This region-based approach enables the assessment of whether a detected point falls within the actual effective strike range of the aircraft. Consequently, it allows for the provision of a tactical performance metric that simultaneously reflects numerical errors, such as RMSE, and the hit probability in practical combat scenarios.
All training and validation processes were conducted using the PyTorch [13] framework on an Ubuntu 24.04 operating system, establishing a high-speed computing environment equipped with an NVIDIA RTX 50-series GPU.
3.2. Performance Evaluation Metrics and Comparative Baseline Selection
In this study, to comprehensively validate the performance of the proposed UAV vulnerability detection model, Intersection over Point (IoP), Root Mean Square Error (RMSE), and Frames Per Second (FPS) were introduced as the primary evaluation metrics. IoP determines whether the estimated strike point falls within the predefined target vulnerability region, classifying the result as either a "Hit" or a "Miss". It can also be utilized as a quantitative metric by measuring the hit ratio over the entire test dataset. At this stage, the allowable radius for a successful hit was set to 15 pixels based on an image resolution of 640 × 480. Furthermore, for data points falling outside the target region, the error was defined as the shortest straight-line distance from the region's boundary, and the overall precision of the model was comprehensively analyzed by calculating this distance via RMSE. Examples of RMSE and IoP can be observed in Fig. 7, and their respective definitions are as follows. Fig. 7(a) represents a case where the estimated vulnerability point is located inside the actual vulnerability region, while Fig. 7(b) illustrates a case where the estimated point resides outside the region, along with its corresponding RMSE error. Additionally, FPS, which represents the frame processing speed per second, was analyzed as a supplementary metric to verify real-time operability in practical environments.
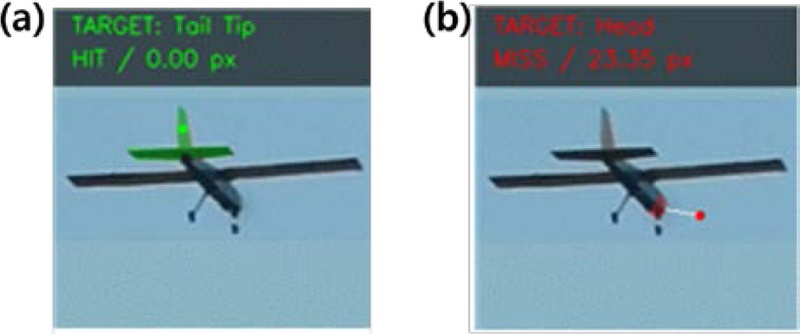
Illustration of target aim point localization error and IoP decision-making process. (a) hit case. (b) miss case.
To validate the efficacy of the proposed methodology, a conventional ORB-based feature point matching approach and a deep learning-based single-point regression approach were selected as comparative baselines. To ensure the objectivity and reliability of the experiment, the data used for establishing the feature point database in the classical technique, as well as the datasets used for training both the baseline and the proposed deep learning models, were strictly controlled under identical conditions, and testing was likewise conducted utilizing the exact same test set.
3.3. Comparative Performance Analysis by Extraction Approach
To demonstrate the superiority of the proposed skeletal structure inference-based vulnerability extraction approach, comparative experiments were conducted against detection methodologies with different mechanisms. The evaluation was based on the IoP hit ratio over the entire test dataset and the RMSE in cases of failure, the results of which are summarized in Tables 2 and 3.

Characteristics and selection of nodes.
Quantitative analysis of prediction errors (RMSE) across RGB and IR datasets.(Unit: pixel)
Success rate of Intersection over Point (IoP) within 15-pixel threshold for RGB and IR datasets.(Unit: %)
First, the ORB matching technique exhibited the lowest performance in both metrics across all scenarios. This is because the matching approach utilizing a pretrained feature point database fails to flexibly adapt to the near-infinite flight scenarios of UAVs and dynamic environmental changes. In particular, in environments with degraded image quality or severe noise in low-resolution IR imagery, the inherent instability of the feature point matching method becomes more pronounced, leading to a significant drop in performance.
Next, the deep learning-based PG-VDNet achieved meaningful performance improvements over the ORB matching approach through a point regression scheme; however, it exhibited similar limitations, showing low precision at localized strike points and susceptibility to image quality degradation. This stems from attempting to infer vulnerabilities without comprehending the overall geometric context of the aircraft. In low-resolution IR imagery or environments with severe blur caused by abrupt maneuvers, the absence of topological constraints to calibrate ambiguous features of the strike regions leads to performance degradation. Consequently, it was confirmed that such an approach relying solely on the localized area around a point has limitations when applied to real-world environments with diverse variables.
In contrast, the SG-VDNet proposed in this study adopts a skeletal structure-guided framework that reflects the topological structure of the aircraft. As a result, compared to PG-VDNet, it achieved a dramatic reduction in RMSE by approximately 40.2% for RGB images and 30.1% for IR images under the Hard environment criteria. Furthermore, the IoP-based hit ratio, which measures how accurately the model infers the intended target regions, improved by approximately 20% to nearly 37%. This remarkable performance leap is attributed to the fact that SG-VDNet enables global context comprehension based on skeletal structure inference. While the single-point regression approach is confined to localized pixel information and remains vulnerable to noise, the proposed model largely overcomes this limitation by inferring the geometric skeletal structure that defines the interrelationships among each component of the aircraft. Consequently, even in harsh environments characterized by the partial occlusion of vulnerable areas, blur induced by high-speed UAV maneuvers, or low resolution caused by long-range capturing, the model ensures robust performance by precisely inferring the locations of strike points based on the underlying skeletal structure of the aircraft.
Lastly, an analysis of the inference speed demonstrated that despite incorporating additional computational structures for skeletal structure restoration, the proposed model achieves a processing speed that is well-suited for real-time applications, as summarized in Table 4. Consequently, the proposed model successfully maximizes strike precision without sacrificing computational efficiency, thereby proving itself to be a highly suitable methodology for practical operational environments.
Computational performance in terms of throughput (FPS) and latency (ms).
3.4. Performance Analysis by Training Strategy
In this section, a comparative experiment based on the loss function configuration was conducted to investigate the impact of the proposed SGL (introduced in Section 2.2.2.3) on the coordinate estimation precision of the UAV's core nodes.
First, the point-based MSE regression method, which directly regresses the coordinate values, exhibited a large RMSE in environments with small target sizes and severe background noise. This approach revealed significant limitations in achieving stable tracking. In contrast, the Gaussian heatmap MSE approach effectively resolved the uncertainty of position estimation by learning the spatial probability distribution of node positions. Consequently, it demonstrated improved performance in both the IoP hit ratio and RMSE compared to the point MSE method. Furthermore, the highest performance was achieved when the proposed SGL was additionally used in the training.
Beyond simple localized position information, the SGL incorporates the structural and geometric constraints of the UAV that connect the head, body center, and tail unit into the training process. This formulation prevented individual nodes from deviating from the valid aircraft anatomy and maximized the IoP performance by precisely inferring target points within the 15-pixel threshold. This superior performance is quantitatively validated by the comparative results summarized in Table 5.
Performance comparison of different loss functions on RGB and IR Hard datasets.
In this section, we quantitatively demonstrate the efficacy of the transfer learning strategy adopted to maximize training efficiency in the IR domain, where labeled data is inherently scarce. A comparative experiment was conducted between a model trained from scratch using only IR data and the proposed transfer learning model fine-tuned on IR data using weights pretrained on a large-scale RGB dataset. For a fair comparison, both models were trained for the exact same number of epochs.
As summarized in Table 6, the model utilizing transfer learning outperformed the model trained from scratch across all evaluation metrics. This performance disparity was particularly pronounced on the Hard Dataset. These results indicate that the structural characteristics and geometric shape information of UAVs learned in the RGB domain were effectively transferred to the IR domain. Accordingly, this demonstrates that highly precise skeletal structure extraction and vulnerability inference are achievable even with a limited amount of IR training data.
Performance comparison of different learning strategies.
3.5. Qualitative Results
In this section, we analyze the qualitative performance of the proposed model by visualizing its actual inference results. Fig. 8 and 9 illustrate the vulnerability detection results across various UAV models depending on the data modality (RGB and IR).
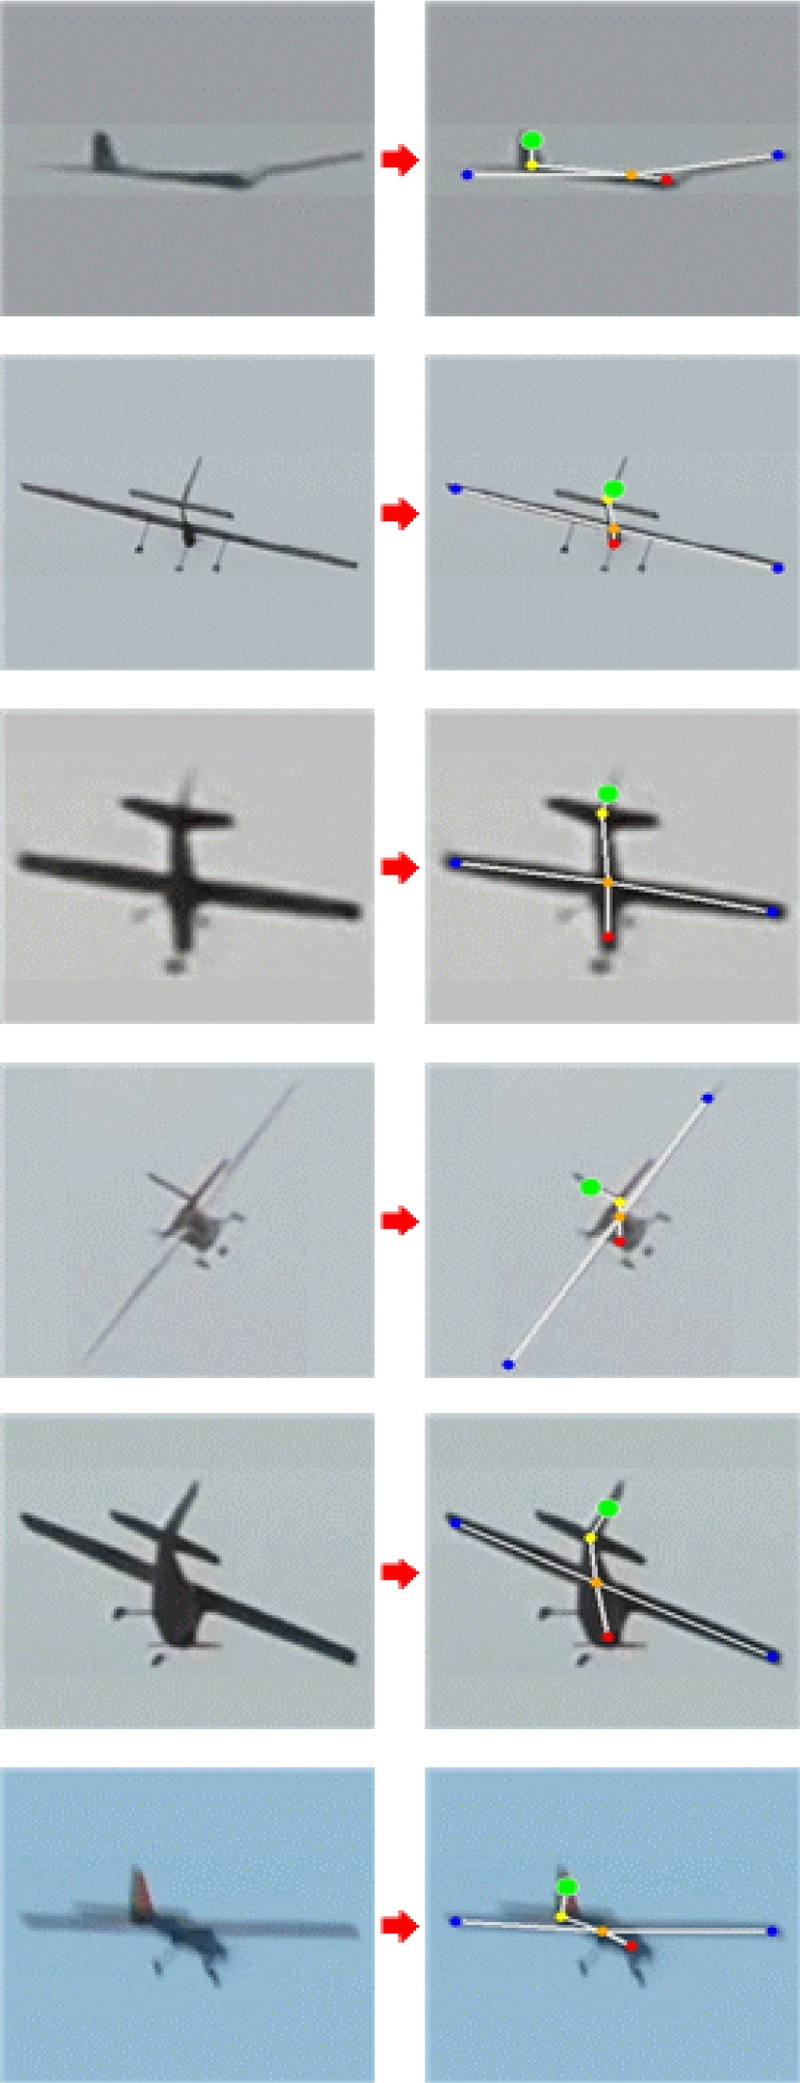
Qualitative inference results of the proposed method across various UAV types (RGB).
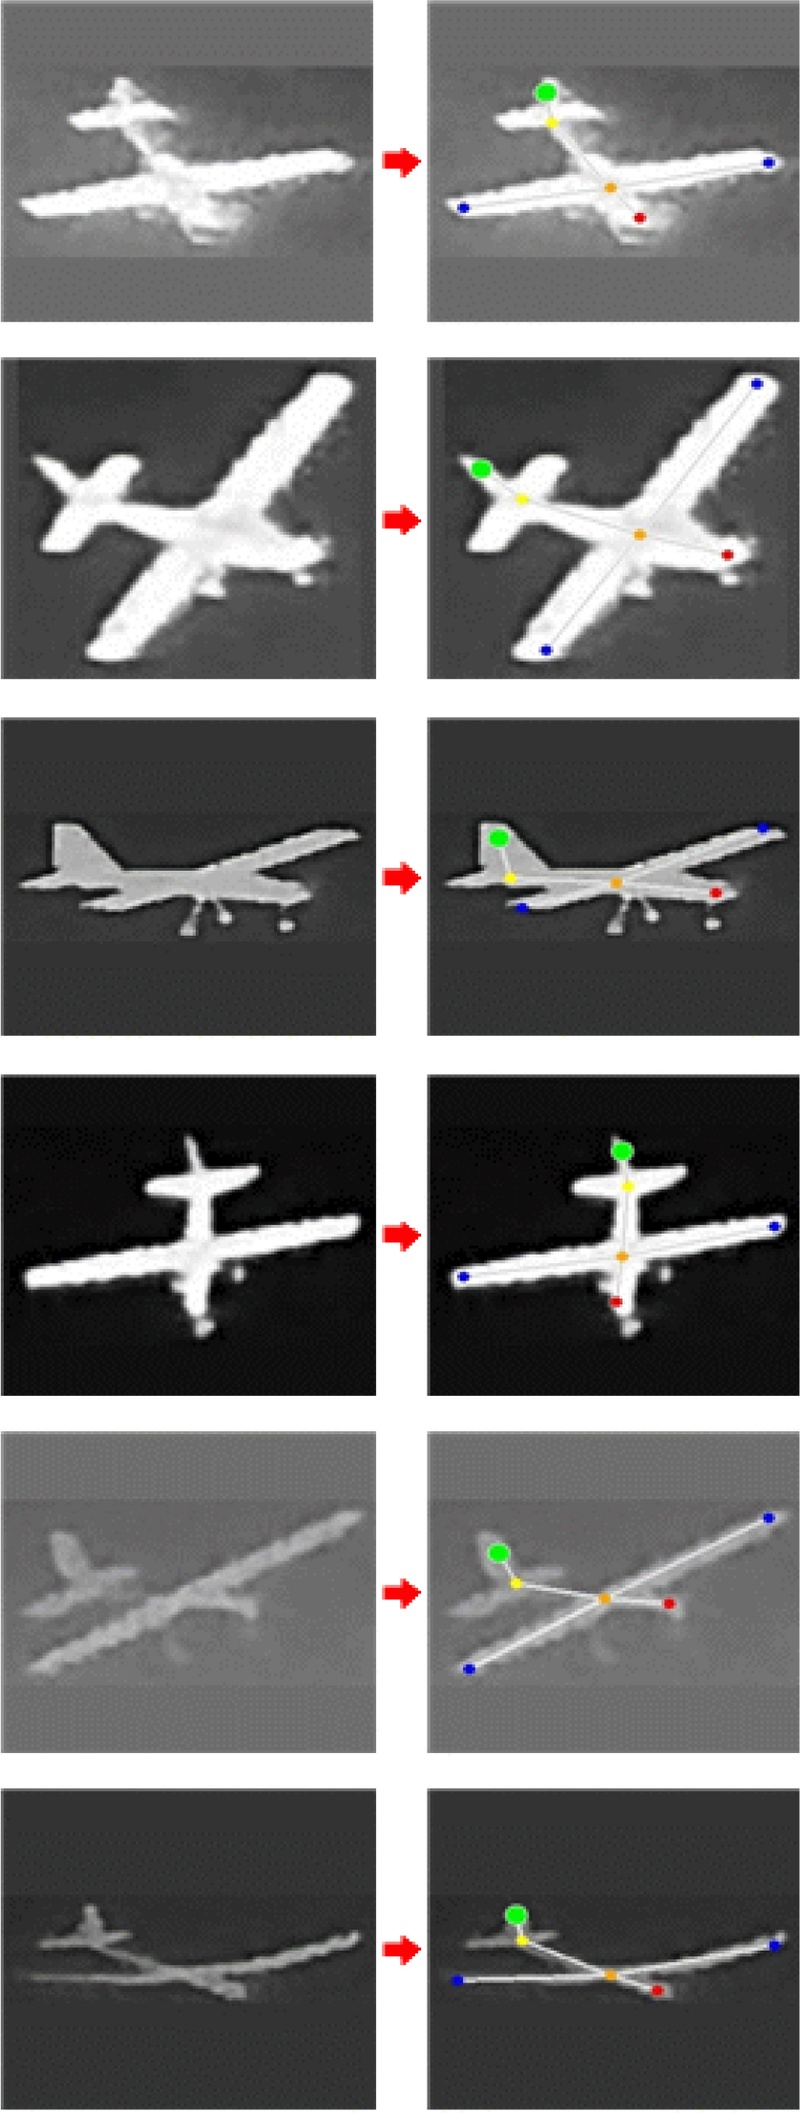
Qualitative inference results of the proposed method across various UAV types (IR).
The left column displays the images that have undergone cropping and padding to comply with the input specification of the model. The right column in each tier presents the inference results, which encompass the restored skeletal structure replicating the geometric configuration of the UAV alongside the finally identified vulnerability.
For consistency, the target vulnerability in all presented images was set to the tail unit. As indicated by the empirical results, the proposed model accurately restored the primary airframe skeleton not only in the RGB environment but also in the challenging IR environment where feature identification is inherently difficult. Based on this restored structural framework, the final target points, highlighted with enlarged markers, were precisely inferred. These visualization results demonstrate that the proposed model operates organically and systematically throughout the entire pipeline, spanning from image preprocessing to structural restoration and final target generation, rather than merely relying on simple, unconstrained point regression. In particular, the capability to yield precise skeletons and target vulnerabilities even under harsh environments with substantial background noise and strict modality constraints indicates that the proposed methodology ensures high reliability and operational readiness across complex deployment environments.
4. CONCLUSIONS
In this study, we proposed a skeletal structure graph-based vulnerability identification system for precision striking and neutralization of UAVs. The experimental results demonstrated that the proposed method ensures stable structural restoration performance. Through transfer learning to the IR domain, it was proven that the skeletal structure knowledge learned in the RGB environment serves as a powerful prior even in feature-sparse IR environments.
However, because this study was optimized based on approximately 10,000 images from six specific aircraft models, it possesses a limitation in that ensuring the same level of precise performance may be challenging for entirely novel shapes or special-purpose UAVs not included in the training phase. Therefore, if future research supplements the training by acquiring a more diverse set of fixed-wing data alongside additional rotary-wing UAV data, the proposed methodology is expected to evolve into a universally applicable vulnerability detection model regardless of the aircraft type.
Acknowledgments
This research was supported by the Korea Research Institute for Defense Technology Planning and Advancement (KRIT) as part of the Core Technology Development Program (Grant No. KRIT-CT-22-014).
REFERENCES
-
M.-W. Shin, A study on the development of high energy laser (HEL) weapon system, J. Korea Acad.-Ind. coop. Soc. 23 (2022) 141–150.
[https://doi.org/10.5762/KAIS.2022.23.5.141]

-
K. Weiss, T.M. Khoshgoftaar, D. Wang, A survey of transfer learning, J. Big Data 3 (2016) 9.
[https://doi.org/10.1186/s40537-016-0043-6]
-
E. Rublee, V. Rabaud, K. Konolige, G. Bradski, ORB: an efficient alternative to SIFT or SURF, Proceedings of the IEEE International Conference on Computer Vision, Barcelona, Spain, 2011, pp. 2564–2571.
[https://doi.org/10.1109/ICCV.2011.6126544]
-
A. Toshev, C. Szegedy, DeepPose: human pose estimation via deep neural networks, Proceedings of the IEEE Conference on Computer Vision and Pattern Recognition, Columbus, USA, 2014, pp. 1653–1660.
[https://doi.org/10.1109/CVPR.2014.214]
-
Y. Sun, X. Wang, X. Tang, Deep convolutional network cascade for facial point detection, Proceedings of the IEEE Conference on Computer Vision and Pattern Recognition, Portland, USA, 2013, pp. 3476–3483.
[https://doi.org/10.1109/CVPR.2013.446]
- J. Tompson, A. Jain, Y. LeCun, C. Bregler, Joint training of a convolutional network and a graphical model for human pose estimation, Adv. Neural Inf. Process. Syst. 27 (2014) 1799–1807.
-
J. Redmon, S. Divvala, R. Girshick, A. Farhadi, You only look once: unified, real-time object detection, Proceedings of the IEEE Conference on Computer Vision and Pattern Recognition, Las Vegas, USA, 2016, pp. 779–788.
[https://doi.org/10.1109/CVPR.2016.91]
-
M. Hussain, YOLO-v1 to YOLO-v8, the rise of YOLO and its complementary nature toward digital manufacturing and industrial defect detection, Machines 11 (2023) 677.
[https://doi.org/10.3390/machines11070677]
-
K. He, X. Zhang, S. Ren, J. Sun, Deep residual learning for image recognition, Proceedings of the IEEE Conference on Computer Vision and Pattern Recognition, Las Vegas, USA, 2016, pp. 770–778.
[https://doi.org/10.1109/CVPR.2016.90]
-
M.D. Zeiler, G.W. Taylor, R. Fergus, Adaptive deconvolutional networks for mid and high level feature learning, Proceedings of the IEEE International Conference on Computer Vision, Barcelona, Spain, 2011, pp. 2018–2025.
[https://doi.org/10.1109/ICCV.2011.6126474]
-
J. Long, E. Shelhamer, T. Darrell, Fully convolutional networks for semantic segmentation, Proceedings of the IEEE Conference on Computer Vision and Pattern Recognition, Boston, USA, 2015, pp. 3431–3440.
[https://doi.org/10.1109/CVPR.2015.7298965]
-
Y. Liu, Z. Sun, L. Xi, L. Zhang, W. Dong, C. Chen, et al., MMFW-UAV dataset: multi-sensor and multi-view fixed-wing UAV dataset for air-to-air vision tasks, Sci. Data 12 (2025) 185.
[https://doi.org/10.1038/s41597-025-04482-2]
- A. Paszke, S. Gross, F. Massa, A. Lerer, J. Bradbury, G. Chanan, et al., PyTorch: an imperative style, high-performance deep learning library, Adv. Neural Inf. Process. Syst. 32 (2019) 8024–8035.