
Growth-Time-Driven Morphology Evolution of CVD-Grown In2O3 Nanostructures and Its Correlation with Acetone Sensing Performance

ⓒ The Korean Sensors Society
This is an Open Access article distributed under the terms of the Creative Commons Attribution Non-Commercial License (https://creativecommons.org/licenses/by-nc/3.0/) which permits unrestricted non-commercial use, distribution, and reproduction in any medium, provided the original work is properly cited.
Abstract
Metal oxides have been extensively studied for gas sensing applications, where the sensing performance strongly depends on the material morphology; however, controlling this morphology remains challenging. Herein, In2O3 nanostructures were fabricated directly on an Au-coated SiO2 substrate by CVD using indium powder as the evaporation source. The effects of growth time and substrate position relative to the vapor source on morphological evolution were investigated at 750°C. At a position 1 cm from the source, the In2O3 morphology transitioned from a nanotower in 5 minutes to a tetrahedral-shaped nanorod in 10 minutes, and formed a nanowire network in 20 minutes. When the substrate was placed farther from the source, the morphological transition was slower. EDS, XRD, and TEM/HRTEM results confirmed that the obtained material mainly consists of In and O, with a crystalline phase consistent with cubic In2O3. Acetone-sensitivity studies showed that the sample grown for 20 minutes at a 1 cm position exhibited the highest response among the studied samples. The sensor exhibited characteristics of an n-type semiconductor oxide, with resistance decreasing upon contact with acetone. Response increased with operating temperature in the range of 250–400°C and increased with acetone concentration from 100 to 1000 ppm at 350°C. The results suggest that controlling growth time and substrate position during CVD is a viable approach to tuning In2O3 morphology and improving acetone-sensitivity characteristics.
Keywords:
In2O3, CVD, Nanowire, Morphological evolution, Gas sensor, Acetone1. INTRODUCTION
Indium oxide (In2O3) is an n-type semiconductor oxide with a fundamental wide band gap of approximately 2.9–3.1 eV due to the deficiency of oxygen [1]. However, strong optical absorption is often observed at higher energy levels in the range of 3.5–3.8 eV [2]. Because of its transparency and good electrical conductivity (n = 7.5 × 1018 cm-3), it has been widely used in transparent conductive electrodes, optoelectronic components, and gas sensors [3-6]. At the nanoscale, the morphology of In2O3 becomes particularly important, as it affects the specific surface area, the density of surface adsorption centers, and the charge-transport pathways in the material [7,8]. Moreover, studies of semiconductor oxide sensors have shown that different crystal and geometric structures lead to significant differences in adsorption capacity, surface reaction, and sensing activity [9-13]. Therefore, morphological control is not just about simple material synthesis, but also about adjusting and optimizing the functional properties of In2O3.
Many studies have synthesized In2O3 with different morphologies, such as nanowires, nanorods, nanobelts, nanocubes, nanosheets, nanopyramids, and nanotowers, using various methods such as CVD, PLD, hydrothermal, or related vapor-phase transport methods [14-17]. Among them, the CVD method is particularly suitable because it allows better control of precursor evaporation, transport, and condensation. Many researchers have confirmed that the Au catalytic layer strongly influences the nucleation and growth of In2O3 via the CVD method. The Au thickness determines the density, uniformity, and morphology of the nanowires by forming suitable Au droplets. Studies synthesizing nanotowers via Au-catalyzed vapor transport show that Au promotes the initial stage (nanoparticle, nanorod), then transitions to self-catalytic VLS-VS. where the HRTEM and EDS analyses showed Au particles at the tip, distinguishing VLS from VS mechanisms [18].
During fabrication, technological parameters such as temperature, time, and the substrate's position relative to the vapor source strongly influence the morphology of In2O3 structures. In the Au-catalyzed vapor transport system using metallic indium (In) powder as a source, stopping the growth process for 2-30 minutes reveals morphological evolution over time, thereby helping to explain the mechanism of formation of different structures. In the Au-catalyzed CVD system using metallic In and O2, adjusting the temperature, In amount, and reaction time allows control of the formation of pyramidal and micro-strip structures of In2O3 [19]. When using In as a vapor source, growth kinetics are highly sensitive to the surface state of the source, as the native oxide layer on the In surface can hinder vaporization and reduce the In vapor flux. Only when this oxide layer is broken at sufficiently high temperatures is the In vapor effectively released [20]. Therefore, the product morphology is strongly dependent on temperature, reaction time, and deposition site, through changes in vapor flux and degree of local supersaturation.
Although numerous studies on In2O3 growth by CVD or vapor transport have investigated the formation of different morphologies according to temperature, source type, catalyst thickness, or high-temperature region, the combined effect of short growth time and substrate position relative to the In powder source in a fixed-temperature Au-catalyzed CVD system has not been systematically presented. Therefore, this work synthesizes In2O3 by CVD from In powder using an Au catalyst, investigating two sets of conditions: changes in growth time and changes in substrate position relative to the vapor source. Based on the SEM, XRD, EDS, TEM, and HRTEM analytical data, the study clarifies the morphological evolution of In2O3 and proposes a growth mechanism influenced by Au, precursor vapor kinetics, and local supersaturation.
2. EXPERIMENTAL
2.1. Preparation of substrate and Au catalyst layer
In2O3 nanostructures were fabricated directly on an Au coated SiO2 substrate using CVD in a horizontal quartz tube furnace (Fig. 1). The Si substrate was surface-cleaned, then coated with a 5 nm-thick Au layer by sputtering to serve as a seed catalyst, supporting the growth of the In2O3 structure.
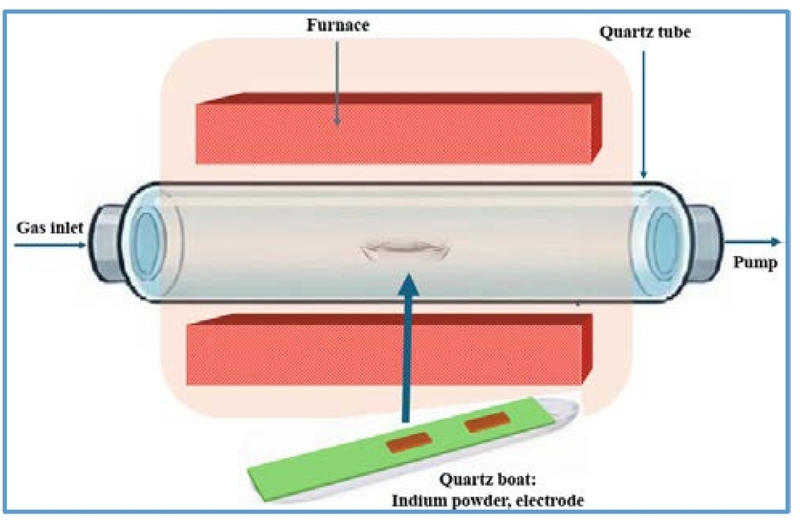
Illustration of a horizontal CVD furnace used for fabricating In2O3 material.
2.2. Synthesis of In2O3 nano material by CVD
The synthesis of In2O3 was carried out in a horizontal quartz tube furnace, as illustrated in Fig. 1. Sigma-Aldrich pure In powder was used as the precursor. In each fabrication run, approximately 0.1 g of In powder was evenly spread on the source boat. Then, the In-powder-loaded boat was placed in the center of the furnace, while SiO2/Au substrates were positioned above the source boat on a quartz glass plate. One end of the boat was left open to allow In/In–O vapor to move to and deposit on the substrate.
The CVD system was purged with Ar gas at 300 sccm for 30 minutes to remove any remaining air and moisture from the quartz tube before heating. The working pressure during the growth process was maintained at approximately 1.4 × 10⁻² Torr. Subsequently, the furnace temperature was raised from room temperature to 750°C in 20 minutes. Once the temperature reached 750°C, O2 gas was introduced at a flow rate of 0.5 sccm to create an oxidizing environment for the formation of In2O3. The reaction time was measured from the moment O2 was first introduced into the system and was investigated at 5, 10, and 20 minutes. After the growth process was complete, the furnace was allowed to cool naturally to room temperature.
2.3. Sample design and material analysis methods
To investigate the effects of growth time and substrate position relative to the vapor source, two substrate positions were examined at 1 cm and 2 cm from the open end of the boat containing In powder. At each position, the reaction times were 5, 10, and 20 minutes, respectively. A total of six samples were studied.
The surface morphology of the samples was investigated using FE-SEM at various magnifications. Elemental composition was analyzed using the EDS attached to the SEM system. The EDS results were primarily used to confirm the presence of the characteristic elements In and O in the sample. The crystalline phase structure of the material was determined by XRD. The obtained diffraction peaks were compared with standard data of the In2O3 phase. The microstructure of representative samples was investigated using TEM and HRTEM. The gas response is determined by the expression S = Rair/Rgas, where Rair is the resistance of the sensor in air, and Rgas is the resistance when in contact with acetone gas. Details of the gas-sensing measurement were reported in ref. [21].
3. RESULTS AND DISCUSSIONS
3.1. Influence of growth time on material morphology
To study the material's development over time, we placed the substrate 1 cm away from the open source of material vapor. The results obtained from SEM analysis in Fig. 2(a–i) show that the material's morphology changed significantly over the growth period. At a reaction time of 5 minutes (Fig. 2(a–c)), the products obtained were mainly nanotower, and micropillar structures, indicating that the material was still in the early morphological growth stage and had not yet formed a complete nanowire network. At higher magnification, the apices of these structures formed a cauliflower-like overgrowth, while the bodies had a rough, uneven surface. This characteristic suggests that, in addition to the initial axial growth, lateral growth also occurred on the structure's wall. This finding is consistent with published In2O3 nanotower growth models, which attribute nanotower formation to the interplay between unidirectional and local, secondary growth at the apex or sidewall [22]. In addition, because the source used was metallic In, the formation of an oxide layer around the source can limit the transfer of In into the gas phase in the initial stage, thereby contributing to the unstable precursor flux and favoring the formation of short, locally grown structures instead of elongated nanowires.
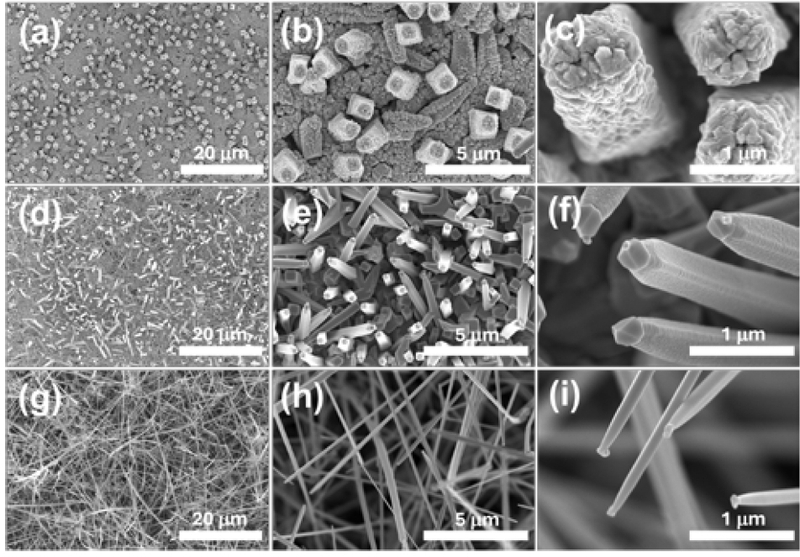
SEM images of In2O3 nanomaterials fabricated by CVD on a SiO2/Au substrate at a position 1 cm from the open end of the source boat for different reaction times. (a–c) 5 minutes. (d–f) 10 minutes. (g–i) 20 minutes.
When the reaction time was increased to 10 minutes (Fig. 2(d–f)), the material morphology changed significantly. The Au substrate surface was almost completely covered by the material, and numerous one-dimensional structures grew upwards from the surface, predominantly in the form of nanorods. At higher magnification (Fig. 2(f)), the nanorods exhibited tetrahedral prisms, with widths of approximately 500 nm and lengths of approximately 5–6 µm. Compared to the 5-minute sample, the nanorod body surface at this stage was smoother, while the tip developed into a characteristic tetrahedral cap. The evolution from the rough nanotower, and micropillar morphology at 5 minutes to the smooth-bodied, faceted nanorod at 10 minutes shows that the growth mechanism changed over time. In the early stages, due to the unstable vapor source from the metallic In and strong lateral growth, the structure mainly developed as a tower with a rough surface and an overgrowth apex. As the growth time increased, the precursor flux became more stable and axial growth gradually took precedence over lateral growth. The transition from lateral to axial growth was observed in In2O3 systems growing from the vapor phase, particularly in models combining VLS, self-catalytic VLS and VS [23], leading to the formation of nanorods with more defined geometries and the tips developing into characteristic faceted caps.
As the growth time continued to increase to 20 minutes (Fig. 2(g–i)), the material morphology transitioned to complete nanowires. At low magnification, (Fig. 2(g)), it can be seen that the nanowires covered almost the entire substrate surface, distributed at a fairly high density, tending to be straight, rigid and relatively uniform in morphology. At higher magnification, (Fig. 2(i)), the wire bodies tended to be rounder, smoother and fairly uniform along the length of the wire. At the tips of the nanowires, droplet-like structures were still observed, unlike the tetrahedral apical structure in the 10-minute growth sample. This suggests that at the longer growth stage, the one-dimensional structure continues to develop in a more stable direction, while the apical morphology retains its distinct characteristics.
3.2. Influence of the substrate position on material morphology
Comparing the results at positions 1 cm and 2 cm from the source in Fig. 3(a–i) shows that the distance of the base from the open end of the source boat strongly influences the material's morphological evolution. Generally, when the base is placed farther from the source, the morphological transition is slower; that is, at the same growth time, the sample at 2 cm usually exhibits a less developed morphology than the sample at 1 cm.
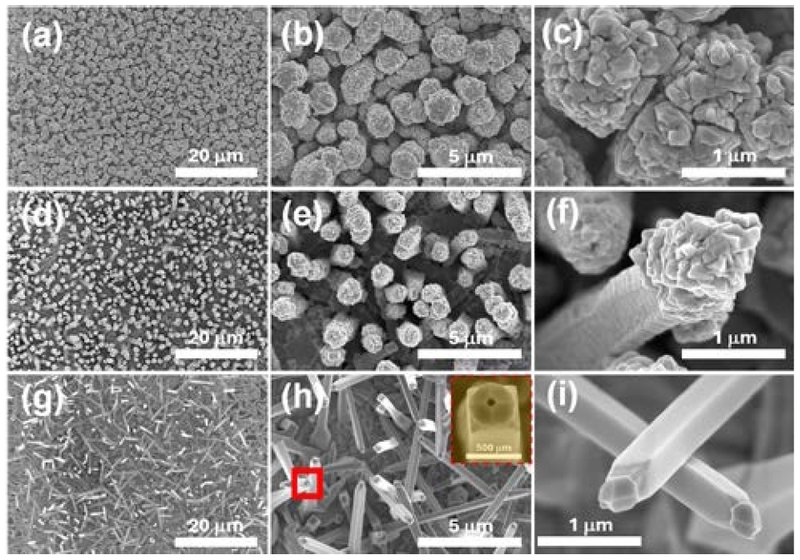
SEM images of In2O3 nanomaterials fabricated by CVD on a SiO2/Au substrate at a position 2 cm from the open end of the source boat for different reaction times. (a–c) 5 minutes. (d–f) 10 minutes. (g–i) 20 minutes.
Specifically, at a growth time of 5 minutes (Fig. 3(a–c)), the sample at 1 cm showed nanotower and micropillar structures with overgrown apical structures resembling flowers or cauliflower, and a rather rough body. Meanwhile, at 2 cm, the material mainly remained as short cylinders with nearly circular cross-sections, measuring about 2–3 µm in height and 1–2 µm in diameter. The surfaces of these structures are also relatively rough, and SEM images suggest that they are composed of overlapping secondary units approximately 500 nm in size (Fig. 3(c)). Compared to the sample at 1 cm, the morphology at 2 cm at this stage shows a lower degree of morphological development and still tends more toward lateral growth.
As the growth time increases to 10 minutes (Fig. 3(d–f)), the difference between the two positions is maintained. At 1 cm, the material has clearly transformed into a nanorod with a smoother body, and the tip has developed into a characteristic tetrahedral shape. Meanwhile, the sample at 2 cm remains mainly in the form of a short, pyramidal column, relatively close to the morphology observed in the 5-minute – 1 cm sample. However, compared to the 5-minute – 2 cm sample, the apex of the structures at 10 minutes – 2 cm (Fig. 3(f)) had developed into a more distinct cauliflower-like shape, while the pyramidal body tended to be slightly smoother. This suggests that morphological evolution at the 2 cm position continued, but at a slower pace than at the 1 cm position.
By the 20-minute growth time (Fig. 3(g–i)), the sample at the 2 cm position had developed into a nanorod, with a morphology relatively similar to the 10-minute – 1 cm sample. The nanorods under these conditions covered almost the entire substrate surface, growing upward from the substrate, with smooth, relatively uniform bodies and tips that developed into umbrella-like structures. Meanwhile, at the 1 cm position, at 20 minutes, the material continued to evolve into complete nanowires with rounder, straighter, and smoother bodies, while the tips maintained a droplet shape rather than a faceted shape as in the 10-minute sample. Thus, at the same time point, the sample at the 1 cm position was always in a later morphological stage than the sample at the 2 cm position.
Increasing the substrate distance from 1 cm to 2 cm slowed the morphological evolution of In2O3: the 2 cm position reproduced the 1 cm morphology, but with a delay, owing to the reduced precursor flux and local supersaturation. This result confirms that the substrate position is an important parameter for controlling the rate of 1D structure growth.

Summary of the morphological evolution of In2O3 nanostructures as a function of growth time and substrate position.
3.3. Structural and compositional characteristics of representative morphologies
The EDS spectra of the representative samples (Fig. 4(a–c)) show the predominant presence of two elements, In and O, confirming that the material obtained is In2O3. The relative content of In and O varies slightly between samples, but this difference is not large enough to definitively confirm a compositional variation trend under the fabrication conditions. Therefore, the EDS results are mainly used to confirm the presence of In and O, whereas the crystalline phase is identified by XRD and further supported by HRTEM.
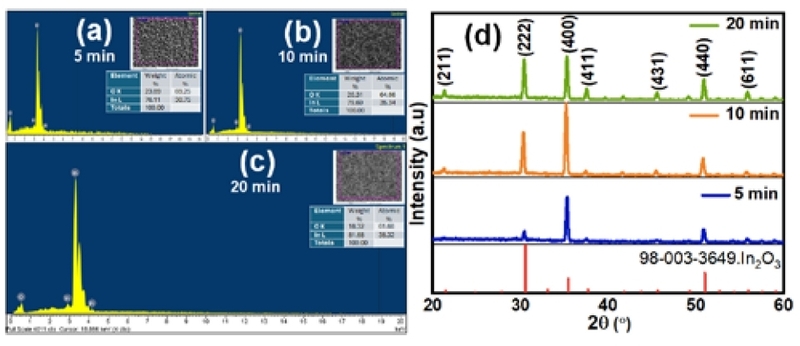
EDS and XRD results of In2O3 samples fabricated by CVD on SiO2/Au substrate at a position 1 cm from the open end of the source boat. (a–c) EDS spectra of the 5, 10, and 20-minute samples. (d) XRD spectra of the corresponding samples.
According to the XRD results for the three samples (Fig. 4(d)), the characteristic diffraction peaks are consistent with the cubic bixbyite In2O3 phase under all three growth conditions. The main peaks appear at 2θ ≈ 21.5°, 30.6°, 35.5°, 37.7°, 45.7°, and 51.0°, corresponding to the crystal planes (211), (222), (400), (411), (431), and (440) [24]. This result shows that the material obtained under all three conditions has the same In2O3 crystal phase, and no significant secondary phase was detected within the XRD detection limit. Although the positions of the peaks remained almost unchanged over the growth time, the relative intensity of the diffraction peaks varied. In particular, for samples grown for longer periods, the characteristic peaks of In2O3 became clearer and sharper, indicating that the material's crystallinity increased with growth time. This is consistent with SEM results, which show that material morphology evolves from short, rough-surfaced structures in the early stages to more refined nanorods and nanowires over longer growth times.
Fig. 5 presents TEM and HRTEM images of In2O3 samples fabricated at different growth times at a position 1 cm from the vapor source. For the 5-minute sample, the TEM image in Fig. 5(a,b) shows a large, rough-bodied structure that has not yet developed into a complete nanowire. As the growth time increases to 10 minutes, a more distinct one-dimensional nanorod structure appears, with a relatively straight body and pointed ends, as shown in Fig. 5(d,e). For the 20-minute sample, the nanowires grow longer, have smoother surfaces, and exhibit characteristic droplet- or bulb-shaped ends, as shown in Fig. 5(g,h). HRTEM images of the samples (Fig. 5(c,f,i)) show distinct lattice patterns. For the 5-minute growth sample, the measured interplanar spacing was approximately 0.292 nm, consistent with the crystal plane (222) of cubic In2O3. This value is consistent with the XRD results, which show a strong diffraction peak from the (222) plane at 2θ ≈ 30.6°. For the 10-minute and 20-minute growth samples, the measured interplanar spacing was approximately 0.413 nm, corresponding to the (211) crystal plane of cubic In2O3. This result is also consistent with the XRD spectrum, in which the diffraction peak corresponding to the (211) plane appears at 2θ ≈ 21.5° [24]. Thus, the HRTEM results provide additional microstructural evidence that the formed In2O3 structures exhibit clear crystalline properties.
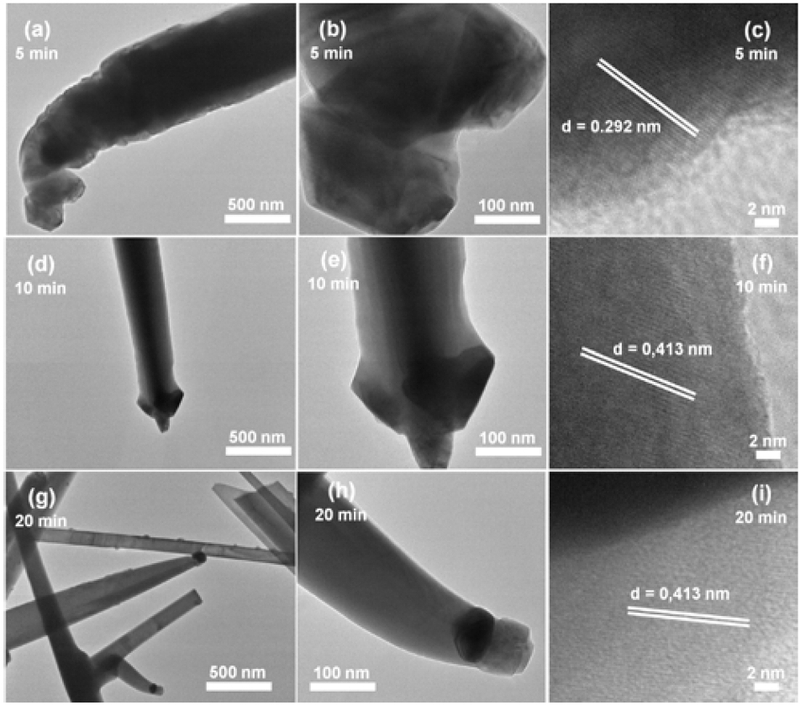
TEM and HRTEM images of representative In2O3 samples fabricated by CVD at a position 1 cm from the open end of the source boat. (a–c) sample grown for 5 minutes. (d–f) sample grown for 10 minutes. (g–i) sample grown for 20 minutes.
3.4. Formation mechanism and morphological evolution
The morphological evolution of In2O3 in CVD systems can be explained by a combination of vapor oxidation of the In source, vapor-phase transport to the substrate, and competition between axial and lateral growth. In Au-catalyzed vapor-grown In2O3 systems, previous studies have shown that the formation of one-dimensional structures may involve a coordination among VLS, self-catalytic VLS, and VS mechanisms [18]. Studies on VLS mechanisms show that the presence of liquid catalyst droplets at the structure tip is the determining factor, in whereby precursors from the vapor phase are adsorbed, reach supersaturation, and crystallize at the liquid-solid interface to drive axial growth [25]. The stable growth of nanowires through catalyst droplets has also been described by theoretical models that relate precursor supply, supersaturation, and axial growth stability [26].
Using metallic In as a precursor and considering only the direct vaporization process from In(l) ® In(g), at 750°C, the Gibbs free energy (ΔG) of the In vaporization process is positive, and the saturated vapor pressure of In is only about P(In) ≈ 1.4 × 10⁻⁴ Torr. The low vapor pressure indicates that direct vaporization of metallic In is not the only way to provide a precursor for the formation of In2O3. In an environment containing O2, the In vapor source is more likely to produce intermediate vapors containing In–O, especially In₂O(g), which is then oxidized and condensed on the substrate to form In2O3.
| (1) |
| (2) |
In this model, the axial growth rate is denoted as vaxial = dL/dt, where L is the length or height of the structure; the lateral growth rate is described by vlateral = (½) dD/dt, where D is the diameter or width characteristic of the structure. The ratio c = vaxial/vlateral is used as a semi-quantitative parameter to represent the growth regime. When χ < 1, lateral growth and secondary deposition predominate; as χ increases, axial growth becomes more pronounced, creating nanorods. When χ > 1, unidirectional growth predominates and leads to the formation of fully grown nanowires. The correlation between axial and lateral growth has been widely used to explain nanowire and nanorod formation in vapor-phase growth systems, especially when there is competition between VLS and VS [27,28].
At 5 minutes, strong nucleation and secondary deposition on the lateral wall make vlateral relatively large, leading to the formation of nanotower structures, micropillars with rough stems, and cauliflower-like apices [22]. As time increases to 10 minutes (χ ≅ 1), the precursor flux becomes more stable, leading to a relative increase in the rate of axial growth over lateral growth. As a result, prismatic nanorods form, with a tetrahedral cap at the nanorod tip [29], on which droplet-like (Figs. 2(f) and 3(i)) and void-like (Fig. 3(h)) features can be observed. These features suggest that the tip may be a material-accumulation region, related to the In-rich phase, or an Au–In/In–O intermediate droplet acting as a precursor-capture site during the growth phase [30]. Material from the tip region may wet or diffuse onto the inclined faces of the tetrahedral cap, then redistribute toward the nanorod body, contributing to a smoother surface. Meanwhile, the central depression may be related to the shrinkage/dissipation of the tip droplet or Kirkendall-type void formation due to unbalanced diffusion [31]. At 20 minutes, unidirectional growth becomes more stable, as reflected in a larger χ, leading to the formation of nanowires with a smooth, straight body and a droplet-like tip.
Applying this mechanism to explain the substrate position, we see that when the substrate is placed closer to the source, at 1 cm, the precursor flux (J) and local supersaturation (S) at the deposition zone are higher, promoting a faster morphological transition from tower to nanorod and nanowire. Conversely, at 2 cm, the decrease in J and S slows the morphological transition [14]; thus, the evolutionary sequence from nanotower to nanorod and then to nanowire can be understood as a function of growth time, substrate location, precursor flux, local supersaturation, and growth ratio χ. In this context, growth time determines the transition between growth modes, while substrate location controls the rate of morphological evolution.
3.5. Acetone-sensitivity characteristics of In2O3 materials
To evaluate the applicability of CVD-fabricated In2O3 structures in gas sensing, the acetone-sensing characteristics were investigated. Acetone is an important volatile organic compound related to breath analysis and medical diagnostics, and metal-oxide sensors have recently been explored for selective acetone detection under practical conditions, including high humidity [32]. In2O3-based nanostructures, including In2O3/Au nanorods and In2O3 nanowires, have been reported as promising sensing materials for volatile organic compounds such as acetone because of their surface-sensitive electrical properties [33]. A representative sample grown for 20 minutes at a location 1 cm from the source was selected, as it exhibited the most complete nanowire morphology. Fig. 6(a) shows the change in the sample's resistance to 1000 ppm acetone at operating temperatures from 250 to 400°C over time. It can be seen that the sensor's resistance decreased at all temperatures investigated when exposed to acetone gas, then increased again when the acetone was removed. This decrease in resistance is consistent with the characteristics of n-type semiconductor oxides, such as In2O3, when exposed to reducing gases [34]. The calculated response, shown in Fig. 6(b), increases with increasing operating temperature from 250 to 400°C. At low temperatures, the reaction between acetone molecules and the oxygen ions adsorbed on the In2O3 surface is weak, so the change in resistance is limited. As the temperature increases, the activation of the surface reaction is promoted, increasing the number of electrons released back into the conduction band of In2O3, reducing the thickness of the depletion layer, thereby increasing the sensor's response.
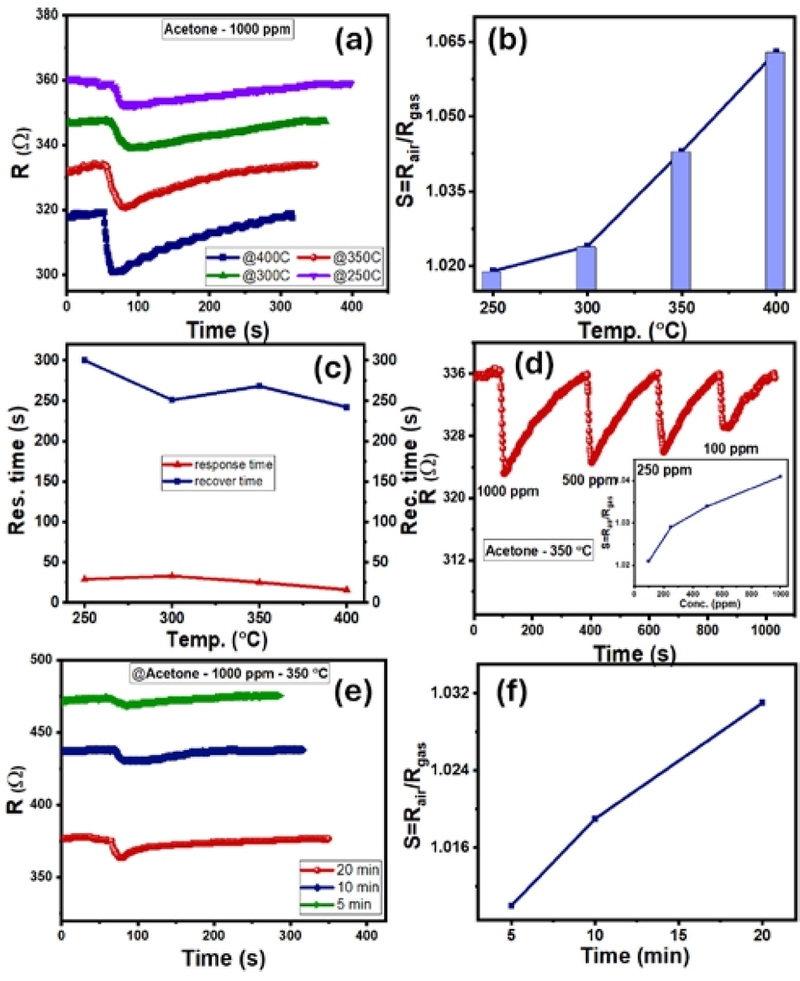
Acetone-sensitive characteristics of In2O3. (a) resistance response of 20-minute sample to 1000 ppm acetone at 250–400°C. (b) temperature response. (c) temperature response and recovery time. (d) resistance response of 20-minute sample to acetone concentrations of 100–1000 ppm at 350°C, inset is concentration response. (e) resistance response of 5, 10, and 20-minute samples to 1000 ppm acetone at 350°C. (f) corresponding response to growth time.
To clarify the influence of growth time and material morphology on gas-sensing properties, samples fabricated for 5, 10, and 20 minutes at a distance of 1 cm from the source were investigated with 1000 ppm acetone at 350°C, as shown in Fig. 6(e). All three samples showed a response to acetone, evidenced by a decrease in resistance upon contact with the gas. However, differences in the background resistance of the materials were also clearly visible, with resistance decreasing as growth time increased. The 5-minute sample, with its predominantly nanotower structure and incomplete nanowire network formation, showed a lower response. This may be related to discontinuous, non-uniform electrical pathways resulting from its highly rough surface. The 10-minute sample, featuring nanorods with smoother bodies and a more defined geometry, showed a higher response than the 5-minute sample. This improvement suggests that the formation of a one-dimensional structure enhances charge-transport efficiency and gas-surface interactions. The 20-minute sample showed the highest response among the three. This result is consistent with SEM analysis, which showed that the 20-minute sample had a more complete nanowire network, covering the substrate surface and forming a more continuous electrical path [35]. The nanowire morphology is advantageous for gas sensing because changes in surface electron density due to adsorption and gas reactions can strongly affect the conductive cross-section of the wire [13]. Simultaneously, the nanowire network distributed on the substrate surface also facilitates gas diffusion and charge exchange on the material surface. The tower-like structures at the base, near the electrode, may contribute to the baseline conductivity of the sensor layer. However, in the 20-minute sample, the nanowire network grew better, increasing the gas contact area, facilitating gas diffusion through the porous structure, creating more wire-to-wire junctions, and enhancing surface resistance modulation, thereby improving the acetone response.
The acetone response mechanism of In2O3 can be explained using the gas-sensing model of n-type semiconductor oxides. In an air environment, oxygen molecules adsorb onto the In2O3 surface and capture electrons from the conduction band to form adsorbed oxygen ions such as , O−, or O2− depending on the operating temperature. This process creates an electron-depletion layer near the surface and increases the electrical resistance of the material [36,37]:
| (3) |
| (4) |
When acetone, a reducing gas, is introduced into the measurement chamber, the acetone molecules react with the adsorbed oxygen ions on the In2O3 surface. This reaction releases electrons back into the conduction band, reducing the width of the electron-deficient region and leading to a decrease in the sensor's resistance:
| (5) |
The observed resistance reduction in the dynamic response curves is consistent with the above mechanism. For the 20-minute sample, the fully developed nanowire structure enhances resistance modulation efficiency due to its large surface area-to-volume ratio, a clearer unidirectional conductive network, and good contact between the acetone gas and the material surface. Therefore, the 20-minute sample at 1 cm from the source is considered to have the most suitable morphology for the acetone response among the conditions investigated.
4. CONCLUSIONS
In2O3 nanostructures were fabricated directly on an Au-coated SiO2 substrate using CVD with metallic In powder as the source. The results showed that growth time and substrate position relative to the vapor source were two important parameters controlling the material's morphological evolution. At a position 1 cm from the source, the morphology transitioned from nanotower structures at 5 minutes, to tetrahedral-shaped nanorods at 10 minutes, and finally to nanowire network formation at 20 minutes. When the substrate was farther away, the morphological transition was slower, indicating the roles of precursor flux and local supersaturation in the growth process. The EDS, XRD, and TEM/HRTEM results confirmed that the obtained material mainly consists of In and O, with a crystalline phase consistent with cubic In2O3 and exhibiting clear crystallinity. Based on morphological and structural results, the evolution from nanotower to nanorod and nanowire is explained by the competition between lateral and axial growth. The 10-minute sample represents a crucial intermediate stage, while the 20-minute sample corresponds to a more stable unidirectional growth regime. In addition, the acetone-sensitive properties show that the In2O3 sample grown for 20 minutes at a distance of 1 cm from the source exhibited the highest response among the samples investigated. The sensor exhibits characteristics of an n-type semiconductor oxide. The response increases with operating temperature in the range of 250–400°C and increases with acetone concentration in the range of 100–1000 ppm at 350°C. This study clarifies the relationship between CVD conditions, morphological evolution, and acetone-sensing properties of In2O3, thereby showing that controlling growth time and substrate location is a viable approach to optimizing morphology and improving gas-sensing characteristics of the material.
Acknowledgments
This research is funded by Vietnam National Foundation for Science and Technology development (NAFOSTED) under the grant number: 103.02-2023.40
REFERENCES
-
P.D.C. King, T.D. Veal, F. Fuchs, Ch.Y. Wang, D.J. Payne, A. Bourlange, et al., Band gap, electronic structure, and surface electron accumulation of cubic and rhombohedral In2O3, Phys. Rev. B 79 (2009) 205211.
[https://doi.org/10.1103/PhysRevB.79.205211]

-
A. Walsh, J.L.F. Da Silva, S.-H. Wei, C. Körber, A. Klein, L.F.J. Piper, et al., Nature of the Band Gap of In2O3 Revealed by First-Principles Calculations and X-Ray Spectroscopy, Phys. Rev. Lett. 100 (2008) 167402.
[https://doi.org/10.1103/PhysRevLett.100.167402]
-
P.D.C. King, T.D. Veal, D.J. Payne, A. Bourlange, R.G. Egdell, C.F. McConville, Surface Electron Accumulation and the Charge Neutrality Level in In2O3, Phys. Rev. Lett. 101 (2008) 116808.
[https://doi.org/10.1103/PhysRevLett.101.116808]
-
O. Bierwagen, Indium oxide—a transparent, wide-band gap semiconductor for (opto)electronic applications, Semicond. Sci. Technol. 30 (2015) 024001.
[https://doi.org/10.1088/0268-1242/30/2/024001]
-
J. Nomoto, T. Koida, I. Yamaguchi, H. Makino, Y. Kitanaka, T. Nakajima, et al., Over 130 cm2/Vs Hall mobility of flexible transparent conductive In2O3 films by excimer-laser solid-phase crystallization, NPG Asia Mater. 14 (2022) 76.
[https://doi.org/10.1038/s41427-022-00421-4]
-
I. Kim, E.D. Park, H.-S. Kim, S.-D. Han, Fabrication of Au-In2O3 Thin/Thick-Film Gas Sensors and Their Sensing Characteristics for Toxic Gases, J. Sens. Sci. Technol. 33 (2024) 516–524.
[https://doi.org/10.46670/JSST.2024.33.6.516]
-
A. Gurlo, M. Ivanovskaya, N. Bârsan, M. Schweizer-Berberich, U. Weimar, W. Göpel, et al., Grain size control in nanocrystalline In2O3 semiconductor gas sensors, Sens. Actuators B Chem. 44 (1997) 327–333.
[https://doi.org/10.1016/S0925-4005(97)00199-8]
-
S. Yang, H. Yin, Z. Wang, G. Lei, H. Xu, Z. Lan, et al., Gas sensing performance of In2O3 nanostructures: A mini review,. Front. Chem. 11 (2023) 1174207.
[https://doi.org/10.3389/fchem.2023.1174207]
-
C. Chen, J. Moir, N. Soheilnia, B. Mahler, L. Hoch, K. Liao, et al., Morphology-controlled In2O3 nanostructures enhance the performance of photoelectrochemical water oxidation, Nanoscale 7 (2015) 3683–3693.
[https://doi.org/10.1039/C4NR07394K]
-
J.H. Kim, S.E. Lee, J.H. Park, H.J. Jin, J.S. Choe, J. Ko, et al., Next-Generation Sensors with Three-Dimensional Micro-/Nano-Structures, J. Sens. Sci. Technol. 33 (2024) 419–428.
[https://doi.org/10.46670/JSST.2024.33.6.419]
-
Z. Lin, Q. Zhu, Y. Dong, S. Liu, J.-G. Li, X. Li, et al., Synthesis and formation mechanisms of morphology-controllable indium-containing precursors and optical properties of the derived In2O3 particles, CrystEngComm 18 (2016) 3768–3776.
[https://doi.org/10.1039/C6CE00115G]
-
K.C. Kam, F.L. Deepak, A.K. Cheetham, C.N.R. Rao, In2O3 nanowires, nanobouquets and nanotrees, Chem. Phys. Lett. 397 (2004) 329–334.
[https://doi.org/10.1016/j.cplett.2004.08.129]
-
A. Gurlo, Nanosensors: towards morphological control of gas sensing activity. SnO2 , In2O3 , ZnO and WO3 case studies, Nanoscale 3 (2011) 154–165.
[https://doi.org/10.1039/C0NR00560F]
-
G. Cheng, E. Stern, S. Guthrie, M.A. Reed, R. Klie, Y. Hao, et al., Indium oxide nanostructures, Appl. Phys. A 85 (2006) 233–240.
[https://doi.org/10.1007/s00339-006-3706-x]
-
H. Dong, H. Yang, W. Yang, W. Yin, D. Chen, Diameter-controlled growth of In2O3 nanowires on the surfaces of indium grains, Mater. Chem. Phys. 107 (2008) 122–126.
[https://doi.org/10.1016/j.matchemphys.2007.06.054]
-
F.N. Tuzluca, Y.O. Yesilbag, M. Ertugrul, Synthesis of In2O3 nanostructures with different morphologies as potential supercapacitor electrode materials, Appl. Surf. Sci. 427 (2018) 956–964.
[https://doi.org/10.1016/j.apsusc.2017.08.127]
-
C. Feng, X. Liu, S. Wen, Y. An, Controlled growth and characterization of In2O3 nanowires by chemical vapor deposition, Vacuum 161 (2019) 328–332.
[https://doi.org/10.1016/j.vacuum.2018.12.055]
-
S.-T. Jean, Y.-C. Her, Growth Mechanism and Photoluminescence Properties of In2O3 Nanotowers, Cryst. Growth Des. 10 (2010) 2104–2110.
[https://doi.org/10.1021/cg9011839]
-
H. Ouacha, U. Kleineberg, H. Albrithen, Morphology control, electronic properties and evolution of light emission in faceted indium oxide structures, J. Phys. D: Appl. Phys. 50 (2017) 455102.
[https://doi.org/10.1088/1361-6463/aa88f6]
-
M. Zervos, D. Tsokkou, M. Pervolaraki, A. Othonos, Low Temperature Growth of In2O3 and InN Nanocrystals on Si(111) via Chemical Vapour Deposition Based on the Sublimation of NH4Cl in In, Nanoscale Res. Lett. 4 (2009) 491–497.
[https://doi.org/10.1007/s11671-009-9266-1]
-
K.J. Choi, H.W. Jang, One-dimensional oxide nanostructures as gas-sensing materials: Review and issues, Sensors 10 (2010) 4083–4099.
[https://doi.org/10.3390/s100404083]
-
Y.-G. Yan, Y. Zhang, H.-B. Zeng, L.-D. Zhang, In2O3 Nanotowers: Controlled Synthesis and Mechanism Analysis, Cryst. Growth Des. 7 (2007) 940–943.
[https://doi.org/10.1021/cg0607194]
-
B. Wang, Z. Zheng, H. Wu, L. Zhu, Field emission properties and growth mechanism of In2O3 nanostructures, Nanoscale Res. Lett. 9 (2014) 111.
[https://doi.org/10.1186/1556-276X-9-111]
-
M. Marezio, Refinement of the crystal structure of In2O3 at two wavelengths, Acta Crystallogr. 20 (1966) 723–728.
[https://doi.org/10.1107/S0365110X66001749]
-
R.S. Wagner, W.C. Ellis, Vapor-liquid-solid mechanism of single crystal growth, Appl. Phys. Lett. 4 (1964) 89–90.
[https://doi.org/10.1063/1.1753975]
-
S.M. Roper, S.H. Davis, S.A. Norris, A.A. Golovin, P.W. Voorhees, M. Weiss, Steady growth of nanowires via the vapor-liquid-solid method, J. Appl. Phys. 102 (2007) 034304.
[https://doi.org/10.1063/1.2761836]
-
A. Vomiero, S. Bianchi, E. Comini, G. Faglia, M. Ferroni, G. Sberveglieri, Controlled Growth and Sensing Properties of In2O3 Nanowires, Cryst. Growth Des. 7 (2007) 2500–2504.
[https://doi.org/10.1021/cg070209p]
-
N. Singh, T. Zhang, P.S. Lee, The temperature-controlled growth of In2O3 nanowires, nanotowers and ultra-long layered nanorods, Nanotechnology 20 (2009) 195605.
[https://doi.org/10.1088/0957-4484/20/19/195605]
-
C. Tessarek, S. Fladischer, C. Dieker, G. Sarau, B. Hoffmann, M. Bashouti, et al., Self-Catalyzed Growth of Vertically Aligned InN Nanorods by Metal-Organic Vapor Phase Epitaxy, Nano Lett. 16 (2016) 3415–3425.
[https://doi.org/10.1021/acs.nanolett.5b03889]
-
J. Jung, D. Kim, Growth evolution of self-catalytic tin-doped indium oxide nanowires, J. Alloys Compd. 823 (2020) 153648.
[https://doi.org/10.1016/j.jallcom.2020.153648]
-
Y. Yin, R.M. Rioux, C.K. Erdonmez, S. Hughes, G.A. Somorjai, A.P. Alivisatos, Formation of Hollow Nanocrystals Through the Nanoscale Kirkendall Effect, Science 304 (2004) 711–714.
[https://doi.org/10.1126/science.1096566]
-
J.-Y. Jeon, D.-G. Shin, Y.K. Moon, Enhanced Acetone Detection in High-humidity Environments Using Cr-doped ε-WO3 Spheres, J. Sens. Sci. Technol. 33 (2024) 255–258.
[https://doi.org/10.46670/JSST.2024.33.5.255]
-
R. Xing, L. Xu, J. Song, C. Zhou, Q. Li, D. Liu, et al., Preparation and gas sensing properties of In2O3/Au nanorods for detection of volatile organic compounds in exhaled breath, Sci. Rep. 5 (2015) 10717.
[https://doi.org/10.1038/srep10717]
-
A. Vomiero, S. Bianchi, E. Comini, G. Faglia, M. Ferroni, In2O3 nanowires for gas sensors : morphology and sensing characterisation, Thin Solid Films 515 (2007) 8356–8359.
[https://doi.org/10.1016/j.tsf.2007.03.034]
-
W. Yang, P. Wan, X. Zhou, J. Hu, Y. Guan, L. Feng, Self-assembled In2O3 truncated octahedron string and its sensing properties for formaldehyde, Sens. Actuators B Chem. 201 (2014) 228–233.
[https://doi.org/10.1016/j.snb.2014.05.003]
-
N. Barsan, M. Schweizer-Berberich, W. Göpel, Fundamental and practical aspects in the design of nanoscaled SnO2 gas sensors: A status report, Fresenius J. Anal. Chem. 365 (1999) 287–304.
[https://doi.org/10.1007/s002160051490]
-
C.M. Hung, D.T.T. Le, N. Van Hieu, On-chip growth of semiconductor metal oxide nanowires for gas sensors: A review, J. Sci. Adv. Mater. Devices 2 (2017) 263–285.
[https://doi.org/10.1016/j.jsamd.2017.07.009]