
Effect of LED Optical Power Feedback Control on Photoactivated Chemiresistive Gas Sensing

ⓒ The Korean Sensors Society
This is an Open Access article distributed under the terms of the Creative Commons Attribution Non-Commercial License (https://creativecommons.org/licenses/by-nc/3.0/) which permits unrestricted non-commercial use, distribution, and reproduction in any medium, provided the original work is properly cited.
Abstract
In photoactivated metal oxide gas sensors, the irradiance reaching the sample is a pivotal variable, yet the optical output of a light-emitting diode (LED) is not fixed by its drive current alone. A four-channel LED irradiation system (385, 450, 527, and 660 nm) with closed-loop optical feedback was built and calibrated in absolute terms against a thermopile optical power meter at the sample position, with the coefficient of determination exceeding 0.999 for all channels. In the constant-optical-power (CP) mode, the output settled to within ±1% of the target in 0.37–11.87 s, with a steady-state error within ±0.2%. Under constant-current (CC) driving at 300 mA, the output fell by 9–11% as thermal droop developed, and a residual coefficient of variation (CV) of 0.39–1.35% persisted over a 9.5 h run, whereas the CV of the CP mode was 0.031–0.059%. In repeated NO2 sensing with Sb-doped SnO2 sensors, the fourth-cycle sensitivity retention was 49.03–53.30% under CP and 7.86–19.93% under CC driving. Holding the drive current constant therefore does not hold the optical output constant; the optical output itself must be taken as the controlled variable.
Keywords:
Photoactivated gas sensor, Constant optical power control, LED irradiation system, Optical power calibration, Thermal droop1. INTRODUCTION
Metal oxide chemiresistive gas sensors typically require high operating temperatures of 200–400°C to promote the adsorption and ionization of oxygen and facilitate surface reactions with target gases [1-6]. High-temperature operation, however, consumes a large amount of power, restricts their application in flammable atmospheres, and degrades both device lifetime and the long-term stability of the sensing performance [1,2,7,8]. Photoactivation has therefore been reported as an alternative route to room-temperature operation [9-13]. Illumination with light of energy corresponding to the band gap of the sensing material generates electron–hole pairs and produces photo-induced adsorbed oxygen ions, which allow the gas reaction to proceed even at room temperature.
De Lacy Costello et al. reported that, for a ZnO nanoparticle sensor activated by a 400 nm light-emitting diode (LED), the irradiance giving the maximum response differed among the target gases (hexane, propane, methane, and ethanol), ranging from 1.5 to 3.7 mW/cm2 [2]. Cho et al. reported that a ZnO nanowire sensor monolithically integrated with a micro LED exhibited a bell-shaped NO2 response with respect to the LED operating power, the optimum power shifting from 6,800 to 244 µW as the device was scaled down [14]. Therefore, irradiance is a pivotal variable for controlling both sensitivity and selectivity. Accordingly, the actual irradiance at the surface of the sensing material, as well as its time-dependent variation, should be accurately determined in a light-illumination system [15]. Such system-level issues, however, have still not been seriously considered in photoactivated gas-sensing studies.
LED self-heating is one of the most important factors to be considered in designing a reliable photoactivation system. The optical output of an LED can exhibit thermal droop even when the drive current is held constant because the junction temperature increases during operation as a result of non-radiative recombination and other loss mechanisms [16]. For instance, in III-nitride LEDs, the internal quantum efficiency decreases by more than 20% when the junction temperature rises from 25 to 150°C at the nominal current [16]. Self-heating develops over tens of minutes after turn-on and therefore overlaps a substantial part of a gas response measurement, whose time scale extends to several hours. Over long-term operation, device degradation compounds this effect. De Lacy Costello et al. observed a linear 30% decrease in the LED optical output over 80 days at a fixed irradiance setting, and pointed out the importance of periodically verifying the set irradiance in gas-sensing experiments [2].
To mitigate these issues, thermal management components such as coolers and heat sinks are commonly employed [17]. However, such approaches cannot completely eliminate temperature variations during LED operation, and the optical output may therefore still drift over time. De Lacy Costello et al. monitored the LED output using a photodiode, demonstrating the importance of tracking optical-output variations during sensor operation [2]. Yet such post-measurement verification cannot compensate for variations in irradiance as they occur, highlighting the need for a real-time feedback system that continuously regulates the optical output during prolonged gas-sensing measurements.
Feeding the detected optical output back to adjust the electrical drive, thereby maintaining a constant optical output, is widely used for laser diodes in optical communication, where it is known as automatic power control [18]. Similar feedback control has also been demonstrated for LEDs with a monolithically integrated monitor photodiode in a sterilization system [19]. However, real-time stabilization of LED optical output in photoactivated gas sensor arrays has rarely been reported.
In this work, a closed-loop optical-feedback LED irradiation system independently controlling four wavelength channels (385, 450, 527, and 660 nm) was built, and each channel was calibrated in absolute terms against a thermopile optical power meter at the sample position. A constant-optical-power (CP) closed loop, which holds the optical output constant by feeding back the signal of a photodetector branched through an optical fiber, was implemented and compared with constant-current (CC) driving of the same hardware, in which only the current is held constant. Using this system, we (1) quantify the variation of the optical output under CC driving, (2) show that CP control suppresses it, and (3) apply the system to NO2 sensing tests using metal oxide gas sensors.
2. SYSTEM DESIGN
2.1 System Configuration
The configuration of the system is shown in Fig. 1. The system independently drives and monitors four LED channels of different wavelengths (UV 385 nm, Blue 450 nm, Green 527 nm, and Red 660 nm). Each channel carries four LEDs in series, providing 16 irradiation points in total, and has its own constant-current driver circuit and optical power measurement path. Because the channels are mutually independent, several wavelengths can be applied simultaneously, or parallel measurements can be performed at different optical powers. The series connection ensures that the four irradiation points of a channel are driven at the same current.
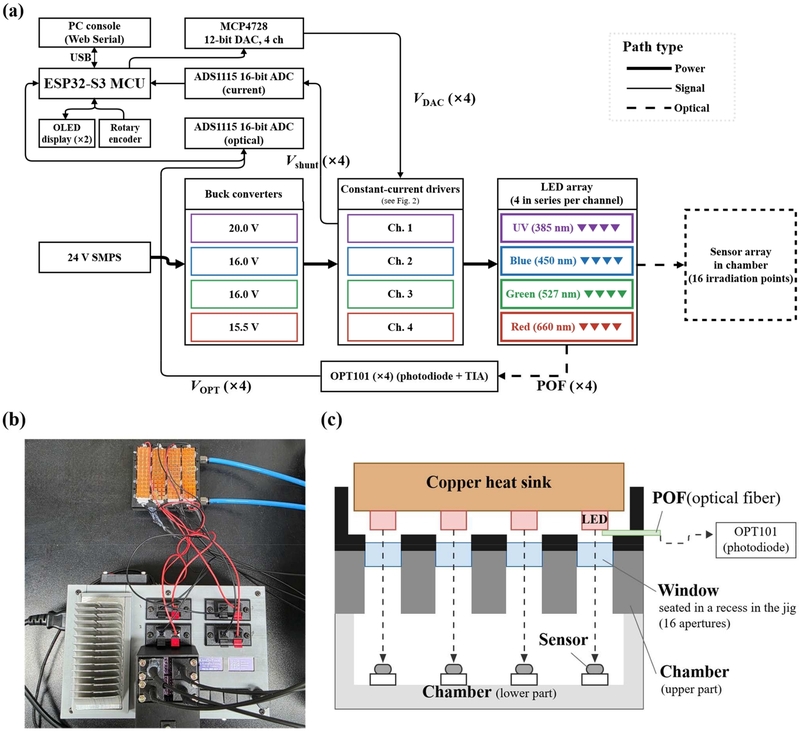
Four-channel LED irradiation system. (a) block diagram with power, signal, and optical paths distinguished, (b) photograph of the assembled system, (c) cross-sectional schematic of the irradiation head for one channel.
The controller is built around an ESP32-S3 microcontroller. A four-channel 12-bit digital-to-analog converter (DAC, MCP4728) generates the current command voltage of each channel, and two 16-bit analog-to-digital converters (ADCs, ADS1115) measure the current sense voltage and the photodetector voltage of each channel. The user interface consists of two OLED displays and a rotary encoder, through which the set value and the measured optical power of each channel can be monitored and the settings adjusted.
The power stage uses a 24 V switched-mode power supply as the main supply, and a buck converter for each channel generates its own supply voltage. The reason for separating the supply voltage by channel is as follows. In a linear constant-current circuit, the power dissipated by the N-channel metal-oxide-semiconductor field-effect transistor (MOSFET) is given by
| (1) |
If a single supply voltage is applied to LEDs whose forward voltages differ with wavelength, an excessive amount of power is dissipated as heat in the channel whose sum of forward voltages is lower. Lowering the supply voltage of each channel to match the sum of the forward voltages of the corresponding LED series string minimized the heat generated by the MOSFET and hence the required heat sinking.
A star ground, in which the return of the high-current path and the signal ground are joined at a single point, was adopted. Since the LED drive current reaches several hundred milliamperes, the voltage drop along a shared ground trace cannot be neglected; without this separation, an error proportional to the drive current would be introduced into the current sense and photodetector signals.
2.2 Constant-Current Driver
A linear constant-current scheme was adopted rather than pulse width modulation, because the optical feedback of the present system requires continuous measurement of the optical output, and pulsed driving constitutes a distinct measurement protocol whose modulation appears in the sensor response [20]. The LED current of each channel is regulated by a circuit consisting of an operational amplifier (OPA4188), a MOSFET (IRLZ44N), and a current sense resistor Rsense = 1 Ω (Fig. 2). The operational amplifier drives the MOSFET gate so that the voltage across the sense resistor becomes equal to the DAC output voltage VDAC, and the LED current is therefore determined by Eq. (2).
| (2) |
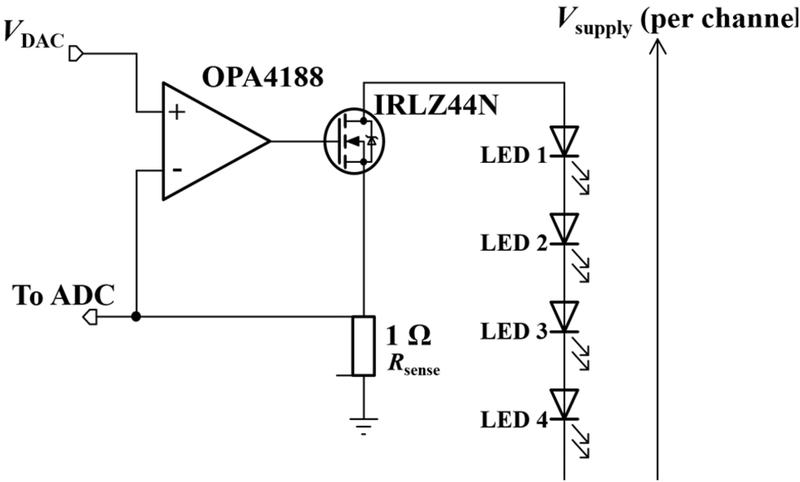
Constant-current driver circuit for one of four identical channels.
The DAC has 12-bit resolution and uses an internal reference voltage of 2.048 V, so its minimum voltage step is 0.5 mV, which corresponds to a current resolution of 0.5 mA with Rsense = 1 Ω. The setting step in the user interface is 5 mA, and the setting range is 0–700 mA.
At the maximum current of 700 mA, the power dissipated in Rsense is I²R = 0.49 W, so a resistor rated at 10 W with a tolerance of 0.1% and a temperature coefficient of 15 ppm/°C was used to suppress the change in resistance caused by self-heating. The voltage across the sense resistor is measured with a Kelvin (four-terminal) connection, in which separate sense wires are returned independently of the current path. This eliminates the error that arises when the resistance of the wiring and the connections adds to the effective sense resistance, making the actual current lower than the set value.
The maximum input offset voltage of the OPA4188 is 25 µV, which corresponds to a current error of 25 µA with Rsense = 1 Ω. This is 0.5% of the minimum setting step of 5 mA and is negligible over the entire setting range. The IRLZ44N is a logic-level device with a low threshold voltage, so the gate voltage required to carry the operating current lies within the output range of the operational amplifier.
2.3 Optical Power Measurement
A fraction of the optical output of the LEDs in each channel is sampled by a plastic optical fiber (POF) and coupled to a photodetector (OPT101). By mechanically fixing the POF to both the LED and the detector, the optical coupling path was held invariant. The layer structure of the irradiation head and the optical path are shown in Fig. 1(c). The fixed-coupling structure excludes ambient light and mechanical variation between the source and the detector, so that the detected signal corresponds to the LED optical output alone.
The OPT101 integrates a photodiode and a transimpedance amplifier (TIA) in a single package. It was chosen over a TIA assembled from a discrete photodiode and an external operational amplifier because the absence of external wiring in the feedback path keeps the gain stable over time and temperature, which extends the interval over which a calibration remains valid, and because it gives a smaller channel-to-channel spread in characteristics. The output voltage VOPT is measured with the ADS1115 and converted to absolute optical power through calibration.
The emitted optical power of an LED varies with the junction temperature and therefore cannot be inferred from the electrical drive (Section 4.3); a path that directly measures the emitted light was accordingly provided. The measured value therefore reflects any change in the current–optical power relation caused by a change in junction temperature or by device degradation.
2.4 Control and Operating Modes
The firmware provides two driving modes.
CC mode: a proportional–integral (PI) closed loop holds the current measured at the sense resistor at the set value (control period 100 ms). The analog circuit forces the sense voltage to follow the DAC output rather than the set value itself, so this loop removes the residual deviation of the measured current from the set value. The loop is thus closed with respect to the current but open with respect to the optical output, and the photodetector value is only recorded. This mode corresponds to the constant-current driving of previous studies and is used as the reference for comparison in this work.
CP mode: a PI closed loop takes the calibrated absolute optical power as its command value. At every control period, VOPT is measured and converted to optical power, and the DAC output is updated according to the error with respect to the command value. When the LED efficiency falls, for example because of a rise in junction temperature, the loop increases the drive current so that the optical output is maintained. The control period is 100 ms, and the proportional and integral gains are KP = {0.0105, 0.0199, 0.0073, 0.0058} and KI = {0.0232, 0.0441, 0.0162, 0.0128} for the four channels. The integral term is bounded within the output range to prevent integral windup.
The control gains were tuned on the basis of the thermal time constant of each channel. The proportional gain was raised as far as possible without oscillation while the settling behavior and the overshoot were monitored, and the integral gain was set to the level at which the steady-state error was eliminated. Since the plant is a low-pass system dominated by the thermal capacitance of the junction, and the intended use of the system is steady irradiation over a time scale of several hours, steady-state accuracy and the prevention of integral windup were given priority over the optimization of the transient response.
At the start of driving, the integral term is preset to the output value corresponding to 85% of the target optical power, obtained from a per-channel µW/DAC conversion constant, to shorten the initial approach time.
2.5 Data Logging Interface
The instrument can be fully configured and operated using only the front-panel encoder and displays. In addition, a character-based command protocol over USB and a control console on the PC side were implemented to acquire long-term measurement data. At every configured interval, the instrument transmits the time, the driving mode, the target value, the measured optical power, the drive current, and the accumulated dose of each channel as a comma-separated values string, with a minimum logging period of 100 ms. The PC clock is appended as a separate column so that the records can be time-aligned with data acquired by external instruments. The optical output stability evaluation and the control performance evaluation of this work used data acquired through this interface at intervals of 200 ms and 100 ms, respectively.
3. MEASUREMENT METHODOLOGY
3.1 Absolute Optical Power Calibration
To convert the photodetector voltage VOPT into absolute optical power, each channel was calibrated against a thermopile optical power meter (Ophir Centauri with a 3A-PF-12 sensor).
A thermopile sensor was chosen as the reference instrument because its responsivity varies little with wavelength, which allows four channels of different wavelengths to be calibrated against a single reference. The spectral range of the sensor used is 0.15–20 µm, which covers all channel wavelengths of the system (385–660 nm), and its measurement range, from 15 µm to 3 W, covers the entire calibration range.
The sensor head of the power meter (aperture Ø12 mm) was placed inside the chamber at the position normally occupied by the gas sensor, that is, beneath the irradiation window (Fig. 1(c)). The calibrated optical power therefore includes the transmission loss of the irradiation window and corresponds to the optical power actually delivered to the sample plane. The optical power incident on the surface of the sensor substrate (0.5 × 0.5 cm) is, however, only a fraction of the value referred to the sensor head aperture, depending on the size and the distribution of the irradiation spot.
For each channel, the drive current was varied from 0 to 700 mA in eight steps while VOPT and the power meter reading P were recorded simultaneously. Since the response time of the thermopile sensor is 2.5 s, the reading was recorded after it had stabilized at each current step. The measured data were regressed with the second-order polynomial of Eq. (3).
| (3) |
The second-order term was included to absorb the slight nonlinearity of the detection path, and the constant term c corrects the zero offset caused by the photodiode dark current and the offset of the amplifier stage.
When the optical path was changed, for example by disassembling and re-coupling the optical fiber joint, only the current–VOPT relation was measured anew, and the coefficients were recalculated, assuming that the current–optical power characteristic of the LED had not changed.
3.2 Evaluation of Constant-Optical-Power Control
To evaluate the transient response of the CP mode, the target optical powers of the four channels were set to 16,100 µW (UV), 14,400 µW (Blue), 6,400 µW (Green), and 8,900 µW (Red), and driving was started from the off state while the optical output was recorded at intervals of 100 ms. The measurement was repeated three times, with the LEDs turned off and allowed to cool for at least 3 min between runs. Forced air cooling was applied during the cooling intervals, while passive cooling was maintained during the measurement intervals.
The evaluation metrics, defined in Section 3.5, were the settling time and the maximum overshoot, together with the steady-state error and the coefficient of variation (CV) over the interval from 90 to 120 s after turn-on.
3.3 Evaluation of Optical Output Stability (CC versus CP)
The optical output stability of the two driving methods (CP and CC) was compared on the same hardware. The decrease in emission efficiency accompanying a rise in junction temperature is a disturbance from the standpoint of optical power control, so comparing the two methods amounts to comparing how well each rejects this disturbance.
In the CC mode the four channels were each driven at 300 mA, and in the CP mode the target values were taken from the power meter calibration of Section 3.1 at the same current, namely 16,100 µW (UV), 14,400 µW (Blue), 6,400 µW (Green), and 8,900 µW (Red), so that the two conditions would be compared at the same optical power. In each mode the system was driven continuously for more than 9 h while the optical output and the drive current were recorded. Only passive heat sinks were applied to the LEDs, and no additional air-cooling system was used. Two independent measurements were performed in each of the constant-current and constant-optical-power modes, and Section 4 presents the results of one session from each. The interval up to 9.5 h after turn-on was used for the analysis.
Since the optical output is not controlled in the CC mode, the transient decrease immediately after turn-on and the residual variation over the subsequent interval were evaluated separately from the recorded optical output. In the CP mode, the trajectory of the drive current adjusted by the loop to maintain the optical output was also recorded.
The evaluation metrics, defined in Section 3.5, were, over the interval from 120 min to 9.5 h after turn-on, the decrease in optical power relative to the mean optical power over the 30–90 s interval immediately after turn-on, the CV, and the maximum-to-minimum deviation. The reference interval was chosen to represent the optical output before the thermal transient of the junction develops, while excluding the initial transient at turn-on, and the comparison interval was chosen to begin after the monotonic component of the decrease has ended. With this definition of the intervals, the decrease remains within 0.2 percentage points for all channels even when the start of the comparison interval is moved anywhere between 30 and 180 min.
3.4 Gas Response Measurement
To evaluate the applicability of the developed optical-power-control system to gas-sensing measurements, repeated NO2 sensing experiments were performed using chemiresistive sensors based on 5% Sb-doped SnO2. SnO2 is a widely used metal oxide chemiresistive material [10], and Sb doping was employed to increase the electron concentration and thereby reduce the electrical resistance of the sensing material.
The Sb-doped SnO2 powder was dispersed in deionized water at a concentration of 20 mg/mL. The sensor substrate was alumina, patterned with an Au interdigitated electrode structure. The prepared Sb-doped SnO2 dispersion was sequentially drop-cast onto the active electrode area three times using 2 µL per deposition. Each subsequent deposition was performed when the previously deposited droplet was nearly dry. After completion of all three deposition steps, the sensors were dried and stabilized on a hot plate at 60°C for 20 min.
Gas-sensing measurements were conducted in a chamber with external dimensions of 9 × 9 × 2 cm and internal dimensions of approximately 7.5 × 7.5 × 1.5 cm. The laboratory temperature was approximately 25°C, and no additional heating was applied to the sensors. All measurements were conducted under dry conditions without externally introduced humidity. For NO2 exposure, 10 ppm NO2 was introduced directly into the chamber at a flow rate of 1000 sccm. After each NO2 exposure, the NO2 supply was terminated and dry air was introduced for sensor recovery. The sensor resistance was measured using a Keysight DAQ970A in the two-wire resistance measurement mode.
Prior to the repeated gas-sensing cycles, the sensors were stabilized for 90 min under dark conditions without LED illumination and then for an additional 30 min under illumination. Subsequently, 10 ppm NO2 was introduced for 10 min, followed by a 120 min recovery period under dry air. This NO2 exposure–recovery sequence was repeated for four consecutive sensing cycles.
The LEDs were driven under the conditions described in Section 3.3, at a constant current of 300 mA in the CC mode and under closed-loop regulation of the optical output in the CP mode.
The same sensors were used for both the CP and CC measurements to minimize sensor-to-sensor variation arising from the manual fabrication process. After completion of one driving condition, the sensors were allowed to recover under an air atmosphere overnight rather than being immediately subjected to the subsequent measurement. The subsequent experiment was initiated only after the initial baseline resistance had recovered to a level comparable to that observed before the preceding measurement. This procedure was employed to minimize the influence of residual effects from the preceding measurement on the comparison between the CP and CC conditions.
3.5 Evaluation Metrics
The optical output stability is evaluated by the mean P̄, the standard deviation SD, and the CV (%) = SD/P̄ × 100 over the measurement interval, and the maximum-to-minimum deviation is defined as (Pmax − Pmin)/P̄ × 100 (%).
The control performance is evaluated by the steady-state error ess (%) = (Pmeas − Pset)/Pset × 100, the maximum overshoot with respect to the target value, and the settling time, defined as the time required to enter and remain within ±1% of the target value. The ±1% criterion was chosen because it is not maintained under constant-current driving (Section 4.3) and because it reflects the objective of the present system, which is to treat the optical power as a controlled experimental variable.
For the gas-sensing measurements, the response of the sensor to NO2, S, was defined as
| (4) |
where Ra is the baseline resistance measured in air immediately before each NO2 exposure, and Rg is the resistance measured immediately before switching from NO2 back to air at the end of the 10 min exposure period. The same definition was applied to all four NO2 sensing cycles.
To evaluate the retention of the sensing response during repeated NO2 exposure, the response obtained in the first sensing cycle, S1, was normalized to 100%. The sensitivity retention for the nth cycle was calculated as
| (5) |
where Sn is the sensor response obtained during the nth NO2 sensing cycle.
In addition, the baseline resistance was normalized to the value measured immediately before the first NO2 exposure, Ra,1, to quantify the baseline drift during repeated sensing cycles. The normalized baseline resistance for the nth cycle was calculated as
| (6) |
where Ra,n is the baseline resistance immediately before the nth NO2 exposure.
4. RESULTS AND DISCUSSIONS
4.1 Absolute Optical Power Calibration
The calibration curve of each channel is shown in Fig. 3. In the second-order regression against the power meter reference, the coefficient of determination exceeded 0.999 for all channels. When the same data were fitted with a first-order expression, the coefficient of determination remained above 0.9996 for the Red and UV channels, whereas it fell to 0.9948 and 0.9957 for the Green and Blue channels, respectively. The nonlinearity of the detection path is thus pronounced in these two channels, and the second-order term absorbs it.
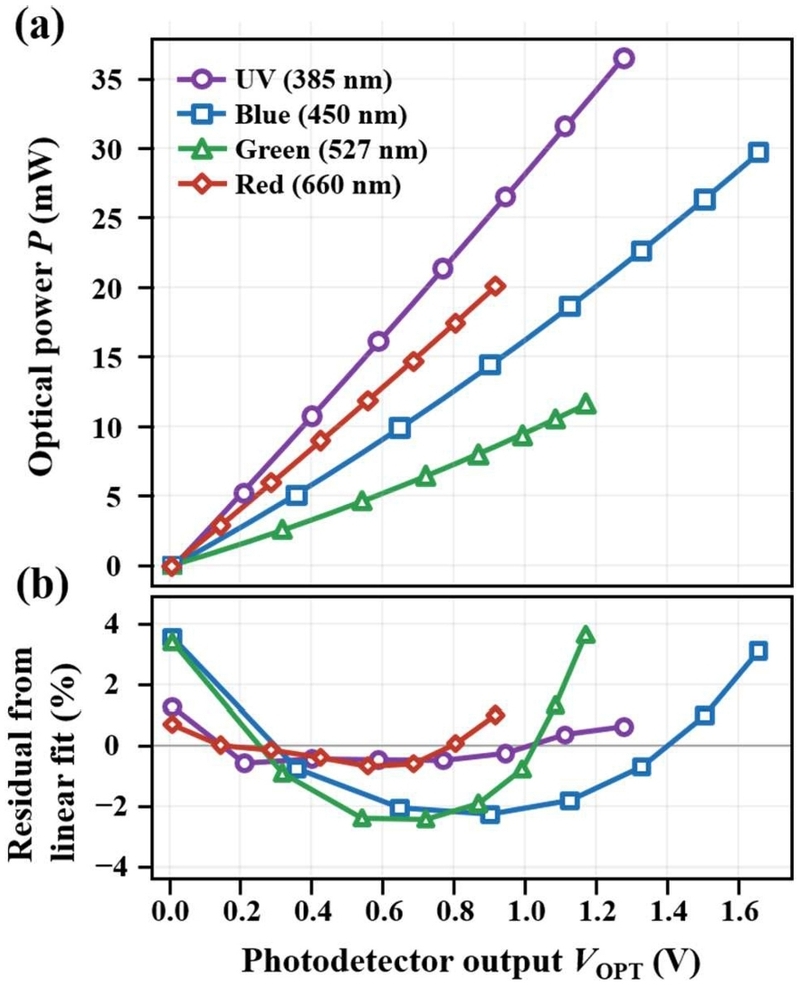
Absolute optical power calibration against a thermopile power meter. (a) measured optical power versus photodetector output voltage with quadratic fits, (b) residuals from a linear fit, normalized to the full-scale power of each channel.
4.2 Constant-Optical-Power Control Performance
The step response of the CP mode is shown in Fig. 4. Over three repeated measurements, the settling time to within ±1% of the target value was 0.37 ± 0.05 s for Red, 1.54 ± 1.02 s for UV, 2.64 ± 1.87 s for Green, and 11.87 ± 0.29 s for Blue. The steady-state error over the interval from 90 to 120 s after turn-on was −0.065% for Red, −0.064% for UV, −0.112% for Blue, and −0.176% for Green, that is, within ±0.2% for all channels, and the CV over the same interval was 0.032–0.058%.
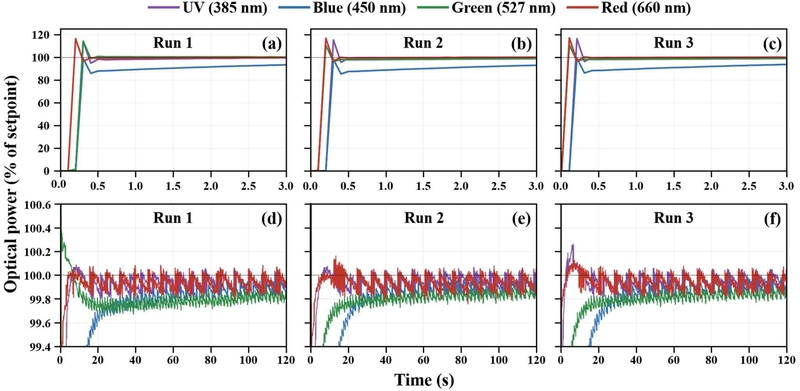
Step response of the constant-optical-power mode, three repeated runs. (a)–(c) first 3 s after turn-on, (d)–(f) first 120 s on an expanded scale.
In the Red, UV, and Green channels, overshoots of 16.7 ± 0.4%, 15.1 ± 1.2%, and 11.9 ± 1.9%, respectively, were observed within 0.1–0.3 s of turn-on and were removed by the closed loop within 0.5 s. Two independent factors act on the initial output value. The µW/DAC conversion constant used to compute it was obtained at thermal equilibrium, whereas the LED is at room temperature at turn-on and its emission efficiency is comparatively high, which raises the initial output in every channel. The constant is also a single linear factor standing in for the second-order calibration of Eq. (3), so its effective value depends on the operating point and its deviation differs in magnitude and sign among the channels. In the Red, UV, and Green channels the two factors act in the same direction and produce overshoot. In the Blue channel the second dominates and acts in the opposite direction, so the initial output reached only about 76% of the target. The target was therefore approached from below without overshoot, as the 85% preset is intended to achieve, but with a correspondingly longer settling time.
Both the channel-to-channel spread and the run-to-run scatter of the settling time are governed by the accuracy of this initial setting, which is consistent with the lower coefficient of determination of the first-order fit in the Green and Blue channels (Section 4.1), where the detection path is the most nonlinear. In contrast, the steady-state error and the CV after the closed loop has taken over differ little among the channels. What governs the settling performance of the present system is therefore not the control gain but the accuracy of the initial setting, and this accuracy can be improved by deriving the initial value from the second-order calibration and by an initialization that reflects the device temperature at turn-on. The longest settling time, 11.87 s, corresponds to 0.03% of the 9.5 h irradiation interval, so the effect of the initial transient interval on the measurement is negligible for the steady-state irradiation over several hours or more for which the present system is intended.
4.3 Optical Output Stability: CC versus CP
The optical output time series of the two driving methods are shown in Fig. 5. When the four channels were driven at 300 mA in the CC mode, the optical output over the interval beyond 120 min after turn-on decreased by 8.96% for Green, 9.97% for Red, 10.89% for Blue, and 11.19% for UV, relative to the 30–90 s interval immediately after turn-on. More than 60% of this decrease occurred within the first 10 min after turn-on, and 19–27 min, depending on the channel, were required before the optical output first came within ±1% of the mean value of the interval beyond 120 min. During this period the current was held at 300.0 mA. In other words, fixing the current with a closed loop does not fix the optical output.
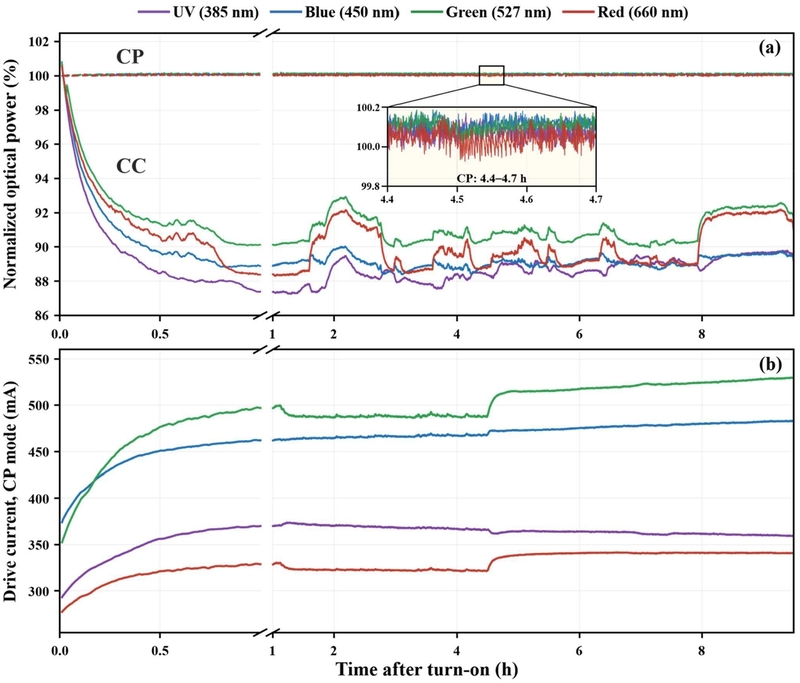
Optical output stability under CC and CP driving over 9.5 h. (a) optical power of each channel normalized to its own mean over 30–90 s after turn-on, the four CP traces overlapping at 100%, with an inset showing CP output at 4.4–4.7 h on a ±0.2% scale, (b) drive current adjusted by the CP loop, with the time axis expanded for the first hour.
The optical output was not constant even after the initial transient had ended. Over the interval beyond 120 min after turn-on, the CV was 0.393% for Blue, 0.626% for UV, 0.925% for Green, and 1.351% for Red, and the maximum-to-minimum deviation was 2.18–4.51%. With respect to the same ±1% band, the fraction of time spent within the band over this interval was 99.2% for Blue, 90.7% for UV, 69.8% for Green, and 39.1% for Red, so the output repeatedly moved outside the band in some channels. This residual variation did not diminish even when the waiting time was extended. The correlation coefficient between channels was highest for Green–Red at 0.981, and was 0.48–0.57 between UV and the other channels.
In the CP mode the CV over the same interval was 0.031–0.059%, lower than in the CC mode by a factor of 11 to 30. The mean error with respect to the target optical power was within 0.003% for all channels. During this period the CP loop adjusted the drive current to maintain the optical output, and in the Green channel the current increased from 357 mA, averaged over the 30–90 s interval to 528 mA at the end of driving. The increase in current was concentrated in the first hour after turn-on, and beyond that interval the channels differed in whether the current increased or decreased. During driving there was an interval in which the current changed by up to several percent over several minutes, but the deviation of the optical output from the target value remained within 0.2% over the same interval. The current trajectory in the CP mode is an indirect indicator of the change in the current required to maintain the same optical output, that is, of the magnitude of the change in emission efficiency.
4.4 Gas Response Measurement Results
The developed optical-power-control system was applied to repeated NO2 sensing measurements using Sb-doped SnO2 sensors under CP and CC driving conditions. Fig. 6 shows the time-dependent resistance responses of the sensors under UV, Blue, Green, and Red illumination during four consecutive NO2 sensing cycles. To more clearly visualize the repeated response and recovery behavior, the first 100 min of the stabilization period were omitted from Fig. 6.
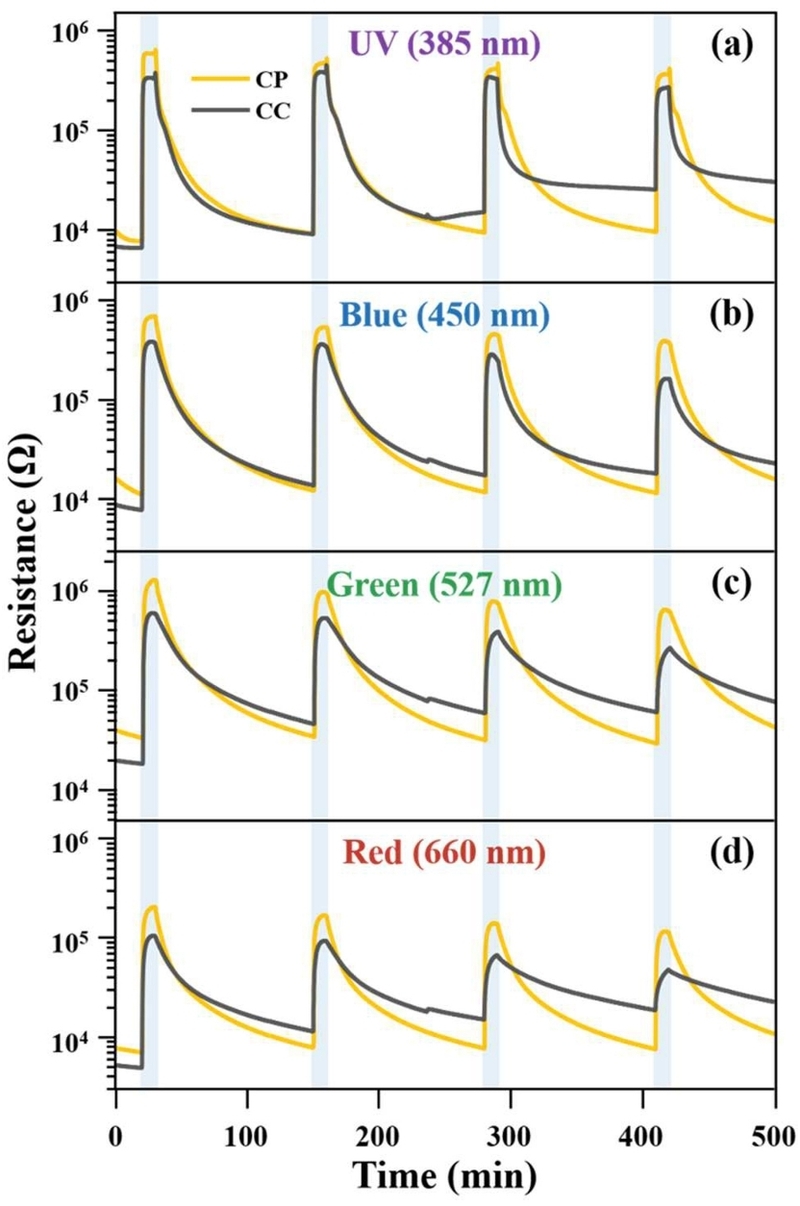
Time-dependent resistance responses of Sb-doped SnO2 sensors under CP and CC operation during four consecutive NO2 sensing cycles under (a) UV (385 nm), (b) Blue (450 nm), (c) Green (527 nm), and (d) Red (660 nm) illumination. Each sensing cycle consisted of a 10 min NO2 exposure followed by a 120 min recovery period under dry air. The first 100 min of the initial stabilization period were omitted for clarity.
For all illumination wavelengths, the sensor resistance increased sharply upon exposure to NO2 and subsequently decreased after NO2 was replaced by dry air, exhibiting the characteristic chemiresistive response of n-type SnO2 toward NO2. In n-type SnO2, adsorbed NO2 acts as an electron-trapping species, thereby reducing the concentration of conduction electrons and consequently increasing the sensor resistance [1].
As the sensing cycles were repeated, markedly different recovery behaviors were observed under the CP and CC conditions. Under CP operation, the resistance showed relatively good recovery after each NO2 exposure. In contrast, under CC operation, the recovery became progressively less complete with repeated cycling, accompanied by a continuous upward shift in the baseline resistance.
The difference became particularly pronounced during the later sensing cycles. For example, under UV illumination, the baseline resistance under CP operation increased from approximately 7.70 kΩ before the first NO2 exposure to 9.53 kΩ before the fourth exposure. In contrast, under CC operation, the corresponding baseline resistance increased from approximately 6.65 to 25.43 kΩ. When normalized to the baseline resistance of the first cycle, the fourth-cycle baseline resistance reached approximately 123.7% under CP operation but 382.4% under CC operation. These results show that, despite the identical 120 min recovery period applied after each NO2 exposure, the cumulative baseline shift was substantially greater under CC driving.
The NO2 responses calculated for each sensing cycle are presented in Fig. 7(a–d). Under CP operation, the response decreased from 75.12 in the first cycle to 36.83 in the fourth cycle for UV illumination, from 60.41 to 30.61 for Blue, from 37.32 to 19.90 for Green, and from 27.98 to 14.12 for Red. In comparison, under CC operation, the corresponding response decreased from 48.12 to 9.59 for UV, from 47.42 to 7.87 for Blue, from 31.03 to 3.44 for Green, and from 20.07 to 1.58 for Red. The degradation in the sensing response over repeated cycles was thus substantially greater under CC operation than under CP operation.
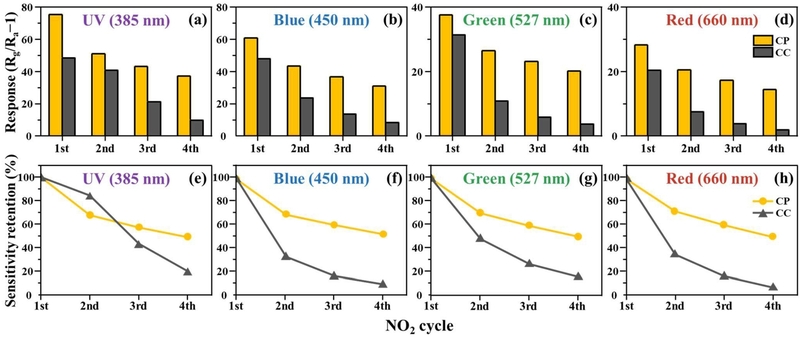
Repeated NO2 sensing characteristics of Sb-doped SnO2 sensors under CP and constant-current CC operation. (a–d) sensor responses and (e–h) sensitivity retention normalized to the first sensing cycle under UV (385 nm), Blue (450 nm), Green (527 nm), and Red (660 nm) illumination, respectively.
To eliminate the influence of differences in the absolute response during the first cycle and directly compare the stability of the sensing response, the first-cycle response was normalized to 100%, as shown in Fig. 7(e–h). Under CP operation, the sensitivity retention in the fourth cycle was 49.03% for UV, 50.67% for Blue, 53.30% for Green, and 50.46% for Red, indicating that approximately half of the initial response was retained for all four illumination wavelengths. In contrast, the corresponding fourth-cycle sensitivity retention under CC operation decreased to 19.93, 16.59, 11.09, and 7.86% for UV, Blue, Green, and Red, respectively.
It should be noted that NO2 is a strongly adsorbing gas and may require a relatively long time for complete desorption and recovery [1]. Although photoactivation can accelerate the adsorption–desorption processes of SnO2 toward NO2 [7,21], the 120 min dry-air recovery period employed in this study may still have been insufficient to completely remove NO2-related surface species. Thus, the decrease in sensitivity observed even under CP operation may partly result from incomplete surface recovery.
Nevertheless, CP operation exhibited substantially more complete recovery than CC operation, with markedly smaller baseline drift. This behavior is consistent with the greater loss of optical power under CC operation, which may reduce the photoactivation effect and consequently slow the desorption and recovery of NO2.
Overall, within the conditions realized in this work, direct measurement and closed-loop regulation of the optical output provided more stable irradiation conditions and improved the cycle-to-cycle stability of photoactivated gas-sensing measurements during prolonged and repeated operation.
5. CONCLUSIONS
A four-channel RGB and UV LED irradiation system was developed and calibrated against a thermopile optical power meter, yielding coefficients of determination above 0.999 for all channels. Under CP operation, the optical output was stabilized with a steady-state error within ±0.2% and a CV below 0.058%. In contrast, CC operation resulted in an approximately 9–11% decrease in optical output after turn-on and substantially larger residual fluctuations, demonstrating that constant current does not ensure constant optical output.
The system was further applied to repeated NO2 sensing using Sb-doped SnO2 sensors. After four sensing cycles, approximately 50% of the initial response was retained under CP operation, whereas the retention decreased to below 20% under CC operation for all illumination wavelengths. Although incomplete NO2 recovery also caused gradual response degradation under CP operation, both the response loss and baseline resistance drift were substantially suppressed compared with CC operation. These results demonstrate that direct feedback control of optical output provides more stable irradiation conditions and improves the cycle-to-cycle stability of photoactivated gas-sensing measurements.
Acknowledgments
This work was supported by Kyungpook National University Research Fund, 2025.
REFERENCES
-
M. Law, H. Kind, B. Messer, F. Kim, P. Yang, Photochemical sensing of NO2 with SnO2 nanoribbon nanosensors at room temperature, Angew. Chem. Int. Ed. 41 (2002) 2405–2408.
[https://doi.org/10.1002/1521-3773(20020703)41:13<2405::AID-ANIE2405>3.0.CO;2-3]

-
B.P.J. de Lacy Costello, R.J. Ewen, N .M. Ratcliffe, M. Richards, Highly sensitive room temperature sensors based on the UV-LED activation of zinc oxide nanoparticles, Sens. Actuators B Chem. 134 (2008) 945–952.
[https://doi.org/10.1016/j.snb.2008.06.055]
-
Y.-M. Jo, T.-H. Kim, C.-S. Lee, K. Lim, C.W. Na, F. AbdelHady, et al., Metal–organic framework-derived hollow hierarchical Co₃O₄ nanocages with tunable size and morphology: Ultrasensitive and highly selective detection of methylbenzenes, ACS Appl. Mater. Interfaces 10 (2018) 8860–8868.
[https://doi.org/10.1021/acsami.8b00733]
-
Y.-M. Jo, K. Lim, H.J. Choi, J.W. Yoon, S.Y. Kim, J.-H. Lee, 2D metal-organic framework derived co-loading of Co₃O₄ and PdO nanocatalysts on In₂O₃ hollow spheres for tailored design of high-performance breath acetone sensors, Sens. Actuators B Chem. 325 (2020) 128821.
[https://doi.org/10.1016/j.snb.2020.128821]
-
K.B. Kim, Y.K. Moon, Y.-M. Jo, S.-Y. Jeong, J.-W. Yoon, C.W. Na, et al., In memoriam: Jong-Heun Lee – A Tribute to His Contributions to the Advancement of Metal Oxide Semiconductor Gas Sensors, J. Sens. Sci. Technol. 35 (2026) 191–215.
[https://doi.org/10.46670/JSST.2026.35.3.191]
- Y.K. Moon, M.S. Shin, Y.-M. Jo, K. Lim, J.-H. Lee, Discrimination of Gasoline and Diesel Fuels Using Oxide Semiconductor Gas Sensors, J. Sens. Sci. Technol. 27 (2018) 221–226.
-
E. Comini, G. Faglia, G. Sberveglieri, UV light activation of tin oxide thin films for NO2 sensing at low temperatures, Sens. Actuators B Chem. 78 (2001) 73–77.
[https://doi.org/10.1016/S0925-4005(01)00796-1]
-
F. Xu, H.-P. Ho, Light-activated metal oxide gas sensors: A review, Micromachines 8 (2017) 333.
[https://doi.org/10.3390/mi8110333]
-
Y.K. Jo, S.-Y. Jeong, Y.K. Moon, Y.-M. Jo, J.-W. Yoon, J.-H. Lee, Exclusive and ultrasensitive detection of formaldehyde at room temperature using a flexible and monolithic chemiresistive sensor, Nat. Commun. 12 (2021) 4955.
[https://doi.org/10.1038/s41467-021-25290-3]
-
K. Lim, Y.-M. Jo, J.-W. Yoon, J.-S. Kim, D.-J. Lee, Y.K. Moon, et al., A transparent nanopatterned chemiresistor: Visible-light plasmonic sensor for trace-level NO2 detection at room temperature, Small 17 (2021) 2100438.
[https://doi.org/10.1002/smll.202100438]
-
Y.-M. Jo, K. Lim, J.W. Yoon, Y.K. Jo, Y.K. Moon, H.W. Jang, et al., Visible-light-activated type II heterojunction in Cu₃(hexahydroxytriphenylene)₂/Fe₂O₃ hybrids for reversible NO2 sensing: Critical role of π–π* transition, ACS Cent. Sci. 7 (2021) 1176–1182.
[https://doi.org/10.1021/acscentsci.1c00289]
-
K. Lee, Y.-M. Jo, M.S. Sohn, M. Jeon, C. Kim, O. Gul, et al., Photoactivated conductive MOF thin film arrays on micro-LEDs for chemiresistive gas sensing, Nat. Commun. 16 (2025) 9612.
[https://doi.org/10.1038/s41467-025-64602-9]
-
Y.-M. Jo, Recent Trends in Conductive Metal–Organic Framework-Based Sensors for Hazardous and Environmental Gas Detection, J. Sens. Sci. Technol. 34 (2025) 585–593.
[https://doi.org/10.46670/JSST.2025.34.5.585]
-
I. Cho, Y.C. Sim, M. Cho, Y.-H. Cho, I. Park, Monolithic micro light-emitting diode/metal oxide nanowire gas sensor with microwatt-level power consumption, ACS Sens. 5 (2020) 563–570.
[https://doi.org/10.1021/acssensors.9b02487]
-
E. Espid, F. Taghipour, UV-LED photo-activated chemical gas sensors: A review, Crit. Rev. Solid State Mater. Sci. 42 (2017) 416–432.
[https://doi.org/10.1080/10408436.2016.1226161]
-
M. Meneghini, C. De Santi, A. Tibaldi, M. Vallone, F. Bertazzi, G. Meneghesso, et al., Thermal droop in III-nitride based light-emitting diodes: Physical origin and perspectives, J. Appl. Phys. 127 (2020) 211102.
[https://doi.org/10.1063/5.0005874]
-
E. Espid, A.S. Noce, F. Taghipour, The effect of radiation parameters on the performance of photo-activated gas sensors, J. Photochem. Photobiol. A 374 (2019) 95–105.
[https://doi.org/10.1016/j.jphotochem.2019.01.038]
-
H. Wang, Z.G. Wang, J. Xu, Y. Luo, P. Miao, S.Y. Yang, et al., A fast automatic power control circuit for a small formfactor pluggable laser diode drive, J. Semicond. 31 (2010) 065014.
[https://doi.org/10.1088/1674-4926/31/6/065014]
-
C.-H. Chen, J.-J. Zhang, C.-H. Wang, Y.-C. Chang, P.S. Yeh, Constant optical power operation of an ultraviolet LED controlled by a smartphone, Sensors 21 (2021) 4707.
[https://doi.org/10.3390/s21144707]
-
L. Mi, Z. Deng, J. Chang, S. Kumar, M. Li, R. Zhang, et al., Decoupling the conflicting roles of photoactivation and boosting chemiresistor response by pulsed UV light modulation, ACS Appl. Mater. Interfaces 15 (2023) 25726–25733.
[https://doi.org/10.1021/acsami.3c04753]
-
T. Hyodo, K. Urata, K. Kamada, T. Ueda, Y. Shimizu, Semiconductor-type SnO2-based NO2 sensors operated at room temperature under UV-light irradiation, Sens. Actuators B Chem. 253 (2017) 630–640.
[https://doi.org/10.1016/j.snb.2017.06.155]