
Conceptual Validation of a Near-Infrared Multi-Wavelength Scattering-Absorption Hybrid Sensor for Water Quality Monitoring

ⓒ The Korean Sensors Society
This is an Open Access article distributed under the terms of the Creative Commons Attribution Non-Commercial License (https://creativecommons.org/licenses/by-nc/3.0/) which permits unrestricted non-commercial use, distribution, and reproduction in any medium, provided the original work is properly cited.
Abstract
This study proposes a near-infrared multi-wavelength scattering-absorption hybrid sensor for integrated water quality monitoring. The sensor is specifically designed to discriminate air bubbles from suspended particles, which represent a major source of error in optical turbidity measurements. Three wavelengths are employed for distinct purposes: 850 nm for turbidity measurements in accordance with ISO 7027, 1450 nm for the detection of bubbles by exploiting the strong absorption band of water, and 660 nm as a reference channel to compensate for light source fluctuations and optical-window fouling. A sample/reference ratiometric dual-detector architecture was adopted for real-time error compensation. Proof-of-concept validation was performed using an extended Beer–Lambert model with literature-derived optical constants, under separately controlled scenarios in which particles and bubbles were considered independently. The discrimination index, R = S(1450) / S(850), remained close to unity for pure water and particle-containing water, whereas it increased to above 5 under bubble-containing conditions with void fractions of 5–30%. A single threshold of Rth = 2.0, whose selection basis and sensitivity are discussed in this paper, successfully classified the three separately simulated conditions with an accuracy of 98% or higher. It should be emphasized that this result represents a proof-of-concept obtained from simulation rather than a measured sensor performance, and that particle-bubble coexistence conditions have not been evaluated here. This work corresponds to the concept-design stage; prototype fabrication and field validation across diverse water industry applications, including particle-bubble coexistence conditions, will be conducted in follow-up studies.
Keywords:
Multi-wavelength optical sensor, Near-infrared spectroscopy, Turbidity, Bubble discrimination, Ratiometric detection, Water industry monitoring1. INTRODUCTION
As social and industrial demands for water safety and process control continue to intensify, the importance of real-time water quality monitoring is increasing across the water industry, including drinking-water treatment plants, wastewater treatment facilities, food and beverage process water, semiconductor and pharmaceutical ultrapure water, water reuse systems, and seawater desalination plants [1,2]. Optical turbidity sensors, which enable reagent-free, non-destructive, and real-time measurements, have therefore been widely deployed in these applications [3]. The international standard ISO 7027-1:2016 specifies a scattering-based measurement method using a near-infrared light source (860 ± 60 nm) and a 90° scattering angle [4,5], and most commercial inline turbidimeters comply with this standard.
However, single-wavelength scattering methods have a fundamental limitation: they cannot distinguish air bubbles from suspended particles, because both produce similar optical scattering signals [6,7]. As summarized in Table 1, bubbles originate from different sources across water-industry sectors, but can generate spurious scattering signals in turbidity sensors. In particular, ozone contact and coagulation mixing in water treatment plants, aeration tanks in wastewater treatment facilities, bottling and pump cavitation in food and beverage processes, pressure fluctuations in industrial water piping, and pressure differences across RO/MF membranes in membrane-separation systems can introduce fine bubbles into the flow [8].

Water quality monitoring requirements and typical bubble sources in each water industry application.
Under such bubble-prone conditions, frequent false alarms may lead operators to routinely disregard the sensor outputs – a phenomenon known as the “Wolf effect” - thereby delaying responses to actual water quality incidents occurs [9]. This problem is not confined to a specific application but is commonly encountered in optical water quality monitoring; therefore, a broadly applicable solution is required across different sectors of the water industry.
Various approaches have been proposed to address this issue. Representative examples include multi-angle scattering measurements based on the ratio of backscattering to forward scattering [10,11], time-domain spike filtering [8], and mechanical de-bubbling as a pre-treatment. However, multi-angle configurations require complex optical alignment and offer limited temporal resolution, time-domain filtering carries the risk of misclassifying signals from low concentrations of suspended particles as bubbles, and mechanical de-bubbling is difficult to implement in inline installations. Ultraviolet absorption at 254 nm is widely used as an indicator of aromatic dissolved organic matter, such as in specific UV absorbance (SUVA) measurements [12,13], but both air bubbles and inorganic particles absorb only weakly at 254 nm, making it unsuitable as a basis for bubble discrimination.
As an alternative approach, this paper proposes a multi-wavelength scattering–absorption hybrid method that exploits the wavelength-dependent absorption characteristics of water itself as the medium. Because water exhibits distinct absorption bands in the near-infrared region originating from overtones of the O–H vibrational mode [14,15], its absorption behavior changes dramatically depending on whether the optical path is occupied by water or by air (bubbles). This difference provides a potential basis for bubble–particle discrimination in water-based monitoring systems.
The main contributions of this paper are as follows. First, a novel spectroscopic bubble–particle discrimination principle is proposed by combining the ISO 7027-compatible 850 nm band with a water-absorption band at 1450 nm; this principle is a universal structure applicable across all water industry sectors. Second, the sample/reference ratiometric dual-detector architecture, previously demonstrated in NDIR gas sensors, is extended to water quality measurement to provide compensation against source drift and optical-window fouling [16,17]. Third, the feasibility of the proposed method is quantitatively evaluated through simulations based on an extended Beer–Lambert formulation and literature-based optical constants.
2. SENSOR SYSTEM DESIGN
2.1 Wavelength selection and physical rationale
Fig. 1 shows the absorption spectrum of pure water over the wavelength range of 400-1900 nm, together with the three wavelengths selected in this study. According to the experimental data reported by Pegau et al. and Segelstein et al., the water absorption coefficient, a(λ), varies by more than four orders of magnitude across this range and exhibits distinct absorption bands associated with overtones and combination bands of the O–H vibrational modes [14,15]. Table 2 summarizes the water absorption coefficient at each selected wavelength and its corresponding optical role in the proposed sensor system.
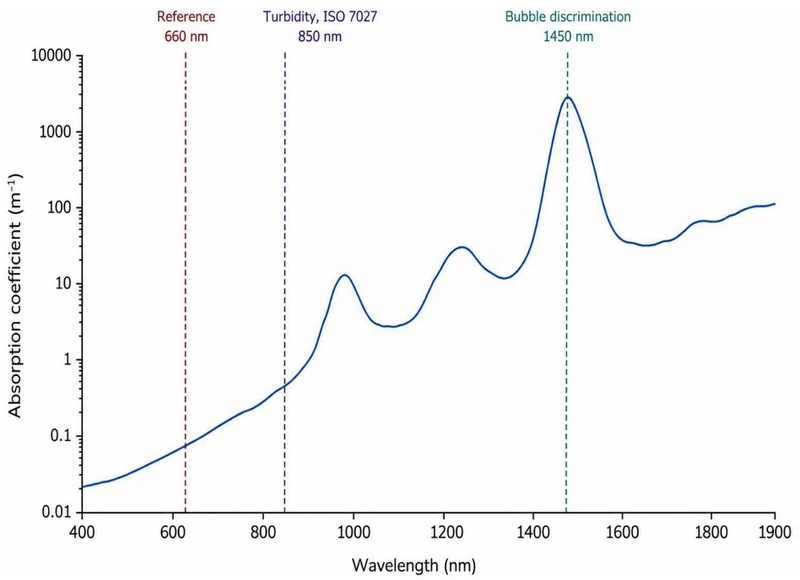
NIR absorption spectrum of pure water and the three wavelengths (660 nm, 850 nm, 1450 nm) selected in this study.
Water absorption coefficient and optical role of each selected wavelength.
Notably, the absorption coefficient of water at 1450 nm is approximately 700 times greater than that at 850 nm. For an optical path length of 10 mm, the transmittance of pure water at 1450 nm is about 5.5 × 10⁻¹³, indicating that the incident light is almost completely absorbed; absorption by air over the same path length is negligible. This substantial difference in absorption forms the physical basis for the wavelength-selective sensitivity to changes in the medium composition along the optical path. Because this principle relies on the intrinsic absorption characteristics of water, it may be broadly applicable to water-based monitoring systems, including those involving ultrapure water, drinking water, wastewater, and process water.
Fig. 2 illustrates this principle using three representative scenarios. In Panel (a), representing pure water, the optical path is completely filled with water, so light at 1450 nm is strongly absorbed and the signal reaching the detector is very low. In Panel (b), representing particle-laden water, the optical path is still occupied by water, so the 1450 nm absorption is maintained, whereas the scattering signal at 850 nm increases due to the presence of suspended particles. In Panel (c), representing bubble-containing water, part of the water in the optical path is replaced by air, thereby reducing absorption at 1450 nm and substantially increasing the corresponding detector signal. Thus, an increase in the 1450 nm signal relative to the water-filled condition can serve as an optical indicator of the presence of bubbles.
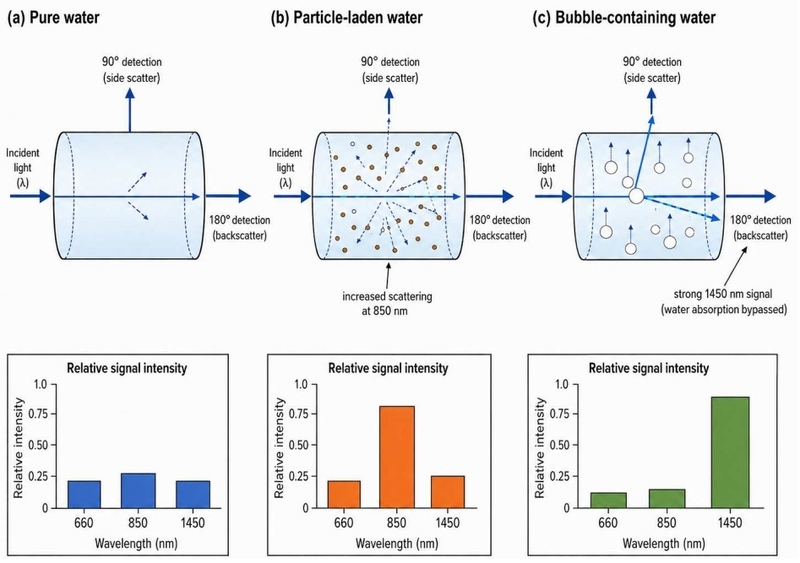
Conceptual illustration of absorption and scattering behavior along the optical path for three scenarios: (a) pure water. (b) particle-laden water. and (c) bubble-containing water.
2.2 Optical system and signal processing architecture
Fig. 3 presents an integrated view of the optical system layout and the signal processing flow of the proposed sensor. Three LED sources (850 nm, 1450 nm, and 660 nm) are driven sequentially by time-division multiplexing (TDM) and combined into a single optical path through a beam combiner. The combined beam is then divided by a beam splitter into two paths: one is guided directly to the reference detector without passing through the sample, while the other enters an in-line flow chamber.
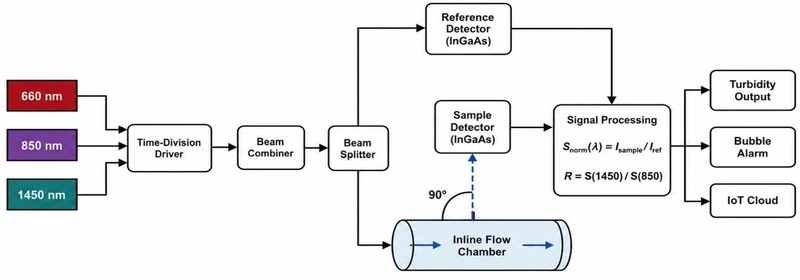
Integrated optical layout and signal-flow block diagram of the proposed three-wavelength time-division LED system with a sample/reference ratiometric dual-detector architecture.
Inside the sample chamber, light scattered by suspended particles or bubbles is collected by the sample detector positioned at 90° with respect to the incident beam. To ensure sufficient sensitivity at 1450 nm, extended-range InGaAs photodiodes covering the 900–1700 nm spectral range are employed. Sapphire or quartz optical windows are used to provide sufficient transmission at 1450 nm. The in-line flow chamber is designed with a standardized flange interface to facilitate integration into various water-industry systems, including drinking- and drainage-water pipelines, aeration tank outlets, bottling lines, ultrapure-water piping, and pipes located upstream of membrane modules.
To compensate in real time for measurement errors arising from source-intensity fluctuations, optical-window fouling, and temperature drift, parallel sample and reference channels are configured for each wavelength. This sample/reference configuration is based on an established architecture commonly employed in NDIR gas sensors and spectrophotometers [16,17]. The measured signal is normalized as
| (1) |
This configuration is designed to compensate for three major sources of measurement error. First, variations in LED output caused by temperature and aging are common to both channels and thus cancel in the ratio. Second, attenuation caused by fouling of the sample-side optical window is partially cancelled, thereby extending maintenance intervals; this is particularly beneficial in wastewater treatment facilities and raw-water intake sections, where optical-window fouling can be significant. Third, because both detectors share the same thermal environment and drift together, temperature-dependent drift can also be reduced.
2.3 Definition of the discrimination index
By extending Beer–Lambert law to account for scattering, the intensity of the signal reaching the 90°-scattering detector after propagation through an optical path of length L can be expressed as
| (2) |
where aw is the absorption coefficient of water, bp is the scattering attenuation coefficient associated with particles, bb is the scattering attenuation coefficient associated with bubbles, and fw is the volume fraction of water in the optical path (fw < 1 when bubbles are present).
Using the normalized signals of the three wavelengths, the bubble–particle discrimination index R is defined as
| (3) |
When bubbles are present, fw becomes less than unity, thereby reducing the water-absorption contribution at 1450 nm in Eq. (2) decreases sharply; S(1450) therefore rises relatively and R increases. When only particles are present, fw remains approximately unity and both wavelengths undergo similar increases in the scattering component, so R remains close to its baseline value. This wavelength ratio is robust against variations in source intensity, optical path length, and absolute turbidity level of the medium, which supports the expectation of consistent discrimination performance across the wide range background turbidity levels encountered in different applications (for example, ultrapure water < 0.1 NTU, raw water < 100 NTU, and sewage < 1000 NTU).
3. OPTICAL MODELING METHOD
3.1 Simulation setup
Based on Eqs. (2) and (3), wavelength-resolved signal responses were calculated for the three simulated scenarios. Table 3 summarizes the simulation parameters and conditions. A turbidity range of 1–500 NTU was considered to represent a broad range of water quality conditions relevant to water-industry applications.
Optical Modeling scenarios and conditions.
The wavelength-dependent water absorption coefficients were obtained by interpolation of the experimental data reported by Pegau et al. [14]. The particle scattering coefficient was derived from a Mie-theory approximation [18] over a log-normal particle-size distribution (0.5–10 μm). An optical path length of L = 10 mm and a scattering angle of 90° were assumed.
3.2 Data processing
For each scenario, N = 80 repeated calculations were performed, with simulated measurement noise corresponding to a standard deviation of 5% added to each calculated signal to approximate hardware-related variability. The discrimination index R was normalized by the median value obtained for the pure-water scenario, so that R₀ = 1. The threshold of Rth = 2.0 was selected based on the following rationale. First, as described in Section 2.1, the substantial difference in water absorption between 1450 and 850 nm causes R to increase as the water fraction, fw, decreases in the presence of bubbles. Accordingly, Rth = 2.0 was selected as an intermediate threshold above the particle-response baseline(R ≈ 1) and below the expected bubble-response range. Second, a simple sensitivity analysis was performed by varying Rth between 1.5 and 3.0 in steps of 0.25, and the resulting classification accuracies are summarized in Table 4. Across this range, the overall accuracy varied by less than 2 percentage points, indicating that the classification performance is not overly sensitive to the exact choice of Rth, and that Rth = 2.0 provides a balanced operating point between false-positive and false-negative rates under the assumed 5% noise level. In field validation, Rth is expected to be fine-tuned according to the background absorption level of the specific water matrix.
Sensitivity of classification accuracy to the choice of Rth.
4. RESULTS AND DISCUSSION
4.1 Wavelength-resolved response for each scenario
Fig. 4 shows the wavelength-resolved normalized signals for the three simulated scenarios. In Panel (a), representing pure water, all three wavelengths exhibit low baseline signals, with the signal at 1450 nm being the lowest because of the strong absorption by water. In Panel (b), representing particle-laden water, the 850 nm signal increases with increasing turbidity, whereas the 1450 nm signal also increases due to particle scattering but remains lower than the 850 nm signal because of the strong water absorption at this wavelength. In Panel (c), representing bubble-containing water, the decrease in fw with increasing void fraction reduces water absorption at 1450 nm, resulting in a pronounced increase in the corresponding signal and a wavelength-response pattern distinct from that observed for particle-laden water.
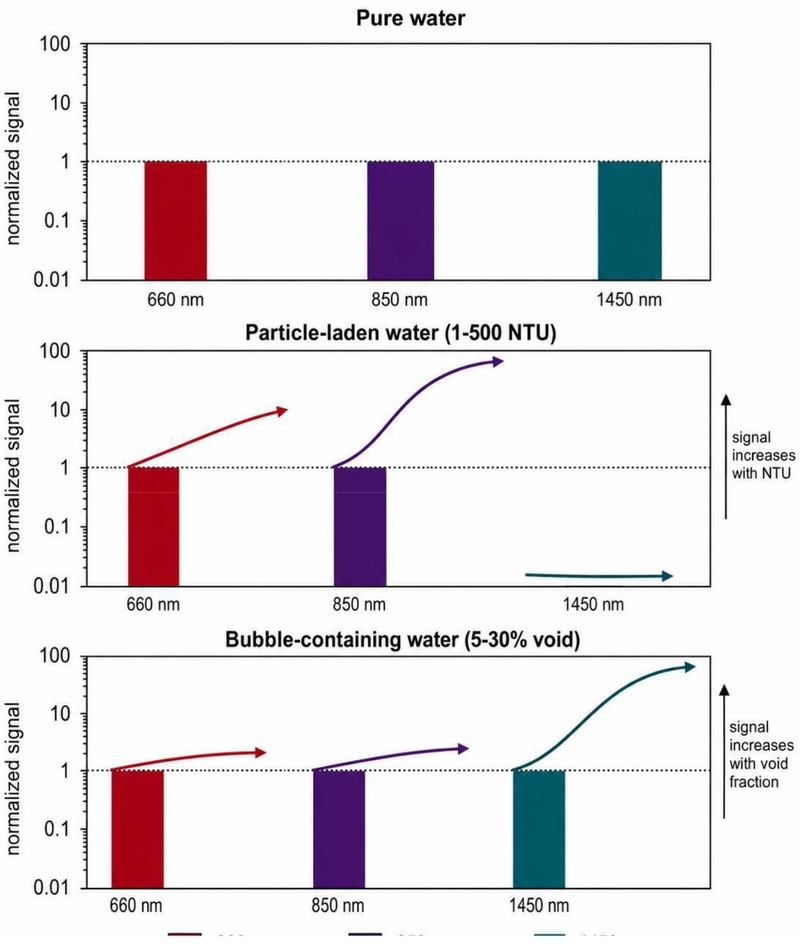
Simulated wavelength-resolved normalized scattering signals for the three scenarios (pure water, particle-laden water 1–500 NTU, and bubble-containing water 5–30% void fraction).
The observed wavelength-dependent responses are consistent with the physical principle described in Section 2.1 (Fig. 2). Although Scenarios B and C are difficult to distinguish based on any single-wavelength signal alone, the relative signal ratio between wavelengths provides a basis for discriminating between the two scenarios.
4.2 Distribution of the discrimination index R and classification performance
Fig. 5 shows the distribution of the discrimination index, R, for the three simulated scenarios. Pure water (Scenario A) and particle-laden water (Scenario B) are concentrated near R ≈ 1, whereas bubble-containing water (Scenario C) is distinctly separated in the range R = 5–50. Table 5 summarized the classification performance obtained using a threshold Rth = 2.0.
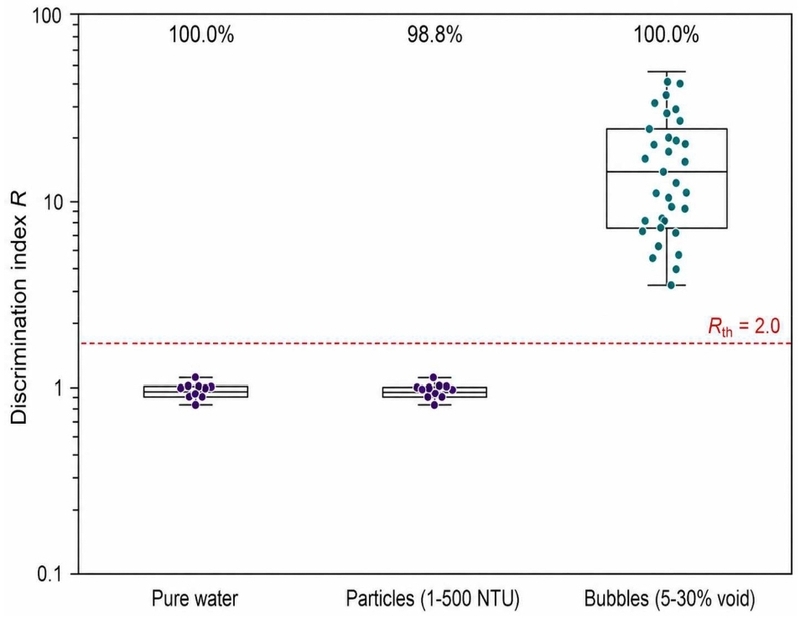
Distribution of the discrimination index R = S(1450) / S(850) for each scenario and the corresponding classification accuracies at the threshold Rth = 2.0.
Simulated classification accuracy at the threshold Rth = 2.0.
The 1.2% misclassification rate observed for Scenario B occurred primarily at high turbidity levels near 500 NTU, where the combination of strong particle scattering and with the assumed 5% measurement noise shifted some R values toward the classification threshold. It should be emphasized that the accuracy values reported here are obtained from simulations using literature-based optical constants and an extended Beer-Lambert model, and therefore represent a conceptual, simulation-based validation rather than a measured performance of an actual sensor. Most water industry applications operate at much lower turbidity than the boundary case (for example, treated water in drinking-water plants < 1 NTU, bottled water < 0.5 NTU, and ultrapure water < 0.1 NTU), so such boundary cases are unlikely to occur in real operation; however, this expectation itself remains to be verified experimentally.
4.3 Discussion and limitations
These simulation results support the conceptual feasibility of distinguish particles from bubbles by incorporating the water-absorption response at 1450 nm into the discrimination index, R, whereas the 850 nm signal alone does not provide sufficient discrimination between the two scenarios. In particular, the fact that R maintains a constant baseline value independent of the absolute turbidity level supports the universality argument, that is, that a single discrimination logic can be applied consistently across the wide range of background turbidities encountered in different water industry applications, from ultrapure water to sewage. However, these findings are based on proof-of-concept simulations using simplified optical models and should not be interpreted as validation of universal applicability or actual sensor performance. Experimental verification using a physical prototype and representative water matrices is therefore required.
Nevertheless, the present modeling has the following limitations. First, and most importantly with respect to the discrimination principle, particles and bubbles were considered as independent scenarios rather than as coexisting scatterers in a single optical path. In real water-industry applications, particles and bubbles may coexist, particularly in aeration tanks, coagulation basins, and bottling lines. Under such conditions, their combined effects on scattering and water absorption may alter the discrimination index, R, relative to the independently simulated scenarios. The present study therefore characterizes only the endpoints of this response space, and the transition behavior under coexistence conditions must be evaluated in dedicated follow-up experiments before the method can be regarded as validated for practical deployment. Second, pure water was assumed as the background medium, but in real applications trace organics, minerals, and color-forming constituents can be present, and their background absorption may affect the discrimination index R and, in turn, the optimal threshold Rth. The expected effects can be summarized as follows. (i) Colored dissolved organic matter, such as humic and fulvic acids in raw or wastewater, exhibits residual absorption tailing into the visible and near-visible NIR, so background absorption at 660 nm and, to a lesser extent, 850 nm may be increased. This tends to reduce the numerator-relative baseline of R and could shift the pure-water and particle-laden distributions slightly downward, effectively increasing the safety margin against the bubble class. (ii) At very high concentrations of organic matter, weak C-H overtone absorption in bands adjacent to 1450 nm may raise the background of S(1450) and thereby elevate the baseline R, which could reduce the effective margin to Rth. (iii) Dissolved minerals such as Ca2+, Mg2+, and Fe species typically show negligible NIR absorption at the selected wavelengths and are not expected to have a first-order effect on R, although Fe-related color may contribute weakly to (i). For these reasons, Rth should be treated as a matrix-dependent parameter that is calibrated in situ for each application (for example, a higher Rth for organic-rich matrices such as wastewater, and Rth close to the present value of 2.0 for clean process water and ultrapure water). Determination of matrix-specific Rth values will be one of the primary tasks in the follow-up field validation. Third, the water absorption coefficient at 1450 nm depends on temperature at approximately 0.5%/°C [14], and a temperature-compensation algorithm will therefore be required during field validation. Fourth, hardware-related factors including the spectral responsivity and dark current of the InGaAs detector and the spectral bandwidth of the LEDs, were not fully incorporated into the present model. Finally, changes in the Mie-scattering characteristics of bubbles across the size distribution (from several μm to several mm) may influence the choice of Rth, and application-specific quantification through field data will be required.
5. CONCLUSION
In this study, a multi-wavelength scattering–absorption hybrid sensor was conceptually designed and evaluated for bubble–particle discrimination in optical water quality monitoring by exploiting the wavelength-dependent near-infrared absorption characteristics of water. It is emphasized at the outset that the validation reported here is entirely simulation-based, using literature optical constants and an extended Beer-Lambert model under scenarios in which particles and bubbles are treated independently; the reported classification accuracies therefore represent conceptual, proof-of-concept results rather than measured sensor performance. The main findings are summarized as follows.
(1) Physical rationale for wavelength selection: Based on literature evidence, a three-wavelength set was derived that combines 850 nm for turbidity measurement in compliance with ISO 7027, 1450 nm — the strong absorption band originating from the overtone of the O–H vibrational mode of water — for bubble discrimination, and 660 nm as a low-absorption reference for source compensation. The nearly 700-fold difference in the absorption coefficient between 850 nm and 1450 nm provides the physical basis for optically distinguishing bubbles from particles, and this principle constitutes a universal structure applicable to any application in which water is the medium.
(2) Academic justification of the optical architecture: A ratiometric dual-detector architecture, in which sample and reference channels are separated, was adopted to secure real-time compensation for source-intensity fluctuations, optical-window fouling, and temperature drift. This represents an extension of a well-established architecture from NDIR gas sensors to water quality measurement, and it physically guarantees long-term stability and reproducibility from wastewater environments with severe optical-window fouling to drinking-water and industrial-water environments that demand long-term uninterrupted operation.
(3) Conceptual simulation-based validation of the discrimination principle: Simulations based on the extended Beer–Lambert formulation and literature optical constants confirmed that the discrimination index R = S(1450) / S(850) can optically separate the bubble scenario (R > 5) from the pure-water and particle-laden scenarios (R ≈ 1). At a physically motivated threshold Rth = 2.0, whose choice was further supported by sensitivity analysis over 1.5 ≤ Rth ≤ 3.0, the three independently simulated three scenarios were classified with accuracies of 98% or higher. These accuracy values are simulation-based indicators of the concept’s feasibility rather than a claim of achieved sensor performance, and they were obtained under separately controlled conditions rather than under particle-bubble coexistence.
(4) Directions for future work. Prototype fabrication and field validation across diverse water industry applications – including drinking-water treatment plants, wastewater treatment facilities, food and beverage process water, and industrial water — are required. The most critical among these is experimental validation under particle-bubble coexistence conditions, which was not covered by the present simulation scope and which is essential for establishing the robustness and practical applicability of the proposed discrimination method. Application-specific effects of background constituents (organics, color, minerals) on the discrimination index and matrix-dependent calibration of Rth, real-time compensation of the temperature dependence of the 1450 nm absorption, and quantitative determination of the threshold as a function of bubble-size distribution are additional subjects for future experimental research. Furthermore, integration with AI-based time-series prediction models is planned as a route toward an intelligent water-management platform at the level of predictive maintenance, which is also aligned with the national policy goal of smart water management.
Acknowledgments
This research was supported by the 2026 Water Enterprise Commercialization Support Program (Challenge, Smart Field) of the Korea Environment Corporation.
REFERENCES
-
H.S. Kang, J.Y. Lee, S. Choi, H. Kim, J.H. Park, J.Y. Son, et al., Smart manufacturing: Past research, present findings, and future directions, Int. J. Precis. Eng. Manuf.-Green Technol. 3 (2016) 111–128.
[https://doi.org/10.1007/s40684-016-0015-5]

- E.W. Rice, R.B. Baird, A.D. Eaton, Standard Methods for the Examination of Water and Wastewater, 23rd ed., APHA, Washington DC, USA, 2017.
-
M. Kumar, K. Khamis, R. Stevens, D.M. Hannah, C. Bradley, In-situ optical water quality monitoring sensors–applications, challenges, and future opportunities, Front. Water 6 (2024) 1380133.
[https://doi.org/10.3389/frwa.2024.1380133]
- ISO 7027-1:2016, Water quality – Determination of turbidity – Part 1: Quantitative methods, ISO, Geneva, Switzerland, 2016.
-
D. Hongve, G. Åkesson, Comparison of nephelometric turbidity measurements using wavelengths 400–600 and 860 nm, Water Res. 32 (1998) 3143–3145.
[https://doi.org/10.1016/S0043-1354(98)00051-7]
-
L.R. Ventura, A.E. Santos, G.V. Buraschi, J.L. Paralovo, M.N. Gallo, L.G. Guimarães, et al., Multi-Wavelength Calibration of a Low-Cost High-Range Turbidimeter: Analysis of the Dispersion Regime, ACS Omega 10 (2025) 52418–52428.
[https://doi.org/10.1021/acsomega.5c05055]
-
Y.J. Knöbl, I. Nakhli, M. del M. Darder, G. Orellana, Luminescence Lifetime-Based Sensing of Water Turbidity, ACS Sens. 10 (2025) 3763–3773.
[https://doi.org/10.1021/acssensors.5c00849]
- Process Instruments Ltd., Bubbles in Turbidity Measurements, Technical Note IST134 (2017).
- L. McKergow, Optical scattering (turbidity and backscatter) sensor selection, High Frequency Water Quality Monitoring Guidance, NIWA Report, 2025.
-
R. Ebrahimifard, P. Erfle, A. Dietzel, G. Garnweitner, Backscattering-Based Discrimination of Microparticles Using an Optofluidic Multiangle Scattering Chip, ACS Omega 7 (2022) 17519–17527.
[https://doi.org/10.1021/acsomega.1c06343]
-
N. Damaschke, H. Nobach, N. Semidetnov, C. Tropea, Optical particle sizing in backscatter, Appl. Opt. 41 (2002) 5713–5727.
[https://doi.org/10.1364/AO.41.005713]
- B.B. Potter, J.C. Wimsatt, Method 415.3, Rev. 1.2: Determination of Total Organic Carbon and Specific UV Absorbance at 254 nm in Source Water and Drinking Water, EPA/600/R-09/122, National Exposure Research Laboratory, U.S. Environmental Protection Agency, Cincinnati, OH, USA, 2009.
-
J.L. Weishaar, G.R. Aiken, B.A. Bergamaschi, M.S. Fram, R. Fujii, K. Mopper, Evaluation of Specific Ultraviolet Absorbance as an Indicator of the Chemical Composition and Reactivity of Dissolved Organic Carbon, Environ. Sci. Technol. 37 (2003) 4702–4708.
[https://doi.org/10.1021/es030360x]
-
W.S. Pegau, D. Gray, J.R.V. Zaneveld, Absorption and attenuation of visible and near-infrared light in water: dependence on temperature and salinity, Appl. Opt. 36 (1997) 6035–6046.
[https://doi.org/10.1364/AO.36.006035]
- D.J. Segelstein, The complex refractive index of water, M.S. thesis, University of Missouri-Kansas City, Kansas City, MO, USA, 1981.
-
J. Hodgkinson, R.P. Tatam, Optical gas sensing: a review, Meas. Sci. Technol. 24 (2013) 012004.
[https://doi.org/10.1088/0957-0233/24/1/012004]
-
L. Feng, Y. Liu, Y. Wang, H. Zhou, Z. Lu, T. Li, Ultra-compact dual-channel integrated CO2 infrared gas sensor, Microsyst. Nanoeng. 10 (2024) 151.
[https://doi.org/10.1038/s41378-024-00782-6]
-
C.F. Bohren, D.R. Huffman, Absorption and Scattering of Light by Small Particles, John Wiley & Sons, New York, 1998.
[https://doi.org/10.1002/9783527618156]