
Effects of Ultrasonic Surface Cleaning and Binder-to-ITO Ratio on the Response Characteristics of Printed ITO Sensors

ⓒ The Korean Sensors Society
This is an Open Access article distributed under the terms of the Creative Commons Attribution Non-Commercial License (https://creativecommons.org/licenses/by-nc/3.0/) which permits unrestricted non-commercial use, distribution, and reproduction in any medium, provided the original work is properly cited.
Abstract
This study investigated the relationship between the surface condition and the operational characteristics of printed indium tin oxide (ITO) sensors in contact with a liquid analyte. ITO nanoparticle film sensors were fabricated on polyethylene terephthalate (PET) substrates using a screen-printing method. Sensor responses were evaluated before and after ultrasonic surface cleaning. Before cleaning, the sensors exhibited incomplete saturation behavior, slow stabilization, lower response linearity, and larger signal fluctuations, particularly at low analyte concentrations. After ultrasonic cleaning, the water contact angle decreased, indicating improved surface wettability, and the sensor response became more stable. To further evaluate the influence of binder content on sensor performance, samples with binder-to-ITO mixing ratios of 0.6:1, 0.8:1, and 1.0:1 were evaluated. Among the tested compositions, the 0.8:1 ratio yielded the most stable saturation response and the lowest variation in differential response. These results indicate that ultrasonic surface cleaning and control of the binder-to-ITO ratio are important for improving the response stability of printed ITO sensors.
Keywords:
Indium Tin Oxide, Liquid sensor, Electrochemical Sensor, Surface Treatment1. INTRODUCTION
Recently, various sensor technologies have been actively developed to address a range of environmental issues, including air [1], soil [2], and marine environments [3,4]. Each sensor measures and analyzes specific chemical and physical parameters depending on its intended purpose. For example, in the field of water quality, parameters such as hydrogen ion concentration (pH) [5], dissolved oxygen (BOD, COD) [6], suspended solids (SS) [7], total nitrogen [8], and total phosphorus (TP) [9] are continuously monitored using individual sensors. However, real-time continuous measurement of low-molecular-weight hazardous chemicals and heavy metal ions remains limited because of their wide variety and complex behavior in water. As a result, the field still relies on intermittent on-site sampling followed by analysis using expensive laboratory equipment [10].
To address these limitations, sensors based on printed films of indium tin oxide (ITO) nanoparticles have been proposed, and their basic operational characteristics have been reported [11]. These sensors detect analyte-induced changes through variations in the electrical properties of the printed ITO film. Previous studies have focused on enhancing sensor sensitivity and improving low-concentration detection performance, confirming the ability to detect substances at the minimum concentrations required for many hazardous chemicals [12].
However, to improve sensor reliability, a thorough examination of issues that cause reaction delays or reduced signal stability is necessary. These issues include electrode surface contamination under typical operating conditions, reduced wettability due to the film’s low surface energy, resistance induced by residual organic binder layers on the surface, and the saturation of active sites. In particular, a sufficient saturation response may not be established in the low-concentration range, which can limit the sensor’s precision and response stability. Furthermore, residual binders or impurities on the surface can interfere with the surface reaction of the analyte, potentially increasing noise.
Accordingly, as in previous studies, this study focused on the effect of the surface state of ITO nanoparticle film sensors on their response characteristics. We investigated the effects of surface treatment and compared response stability, linearity, noise, and saturated/unsaturated behavior. Based on these results, we examined the correlation between the surface condition and sensor performance and further investigated these trends using samples fabricated with varying binder-to-ITO mixing ratios.
2. EXPERIMENTAL
Fig. 1 summarizes the sensor fabrication process used in this study. Fig. 1(a) shows a commercially available polyethylene terephthalate (PET) substrate with a thickness of 350 μm. Fig. 1(b) illustrates the cleaning process for the PET substrate. The substrate was placed in a cleaning carrier and immersed in an ultrasonic cleaner, where it was cleaned in deionized (DI) water for 15 min to remove surface contaminants. The same process was used to clean the surface of the ITO film. The ITO film printing process was optimized based on previous studies [13, 14]. A commercially available ITO powder with a tin (Sn) content of approximately 10% and a particle size of 20–70 nm was used. The film was fabricated using a paste prepared at a binder-to-ITO mixing ratio of 0.8:1. The binder consisted of a mixture of α-terpineol and ethyl cellulose at a weight ratio of 19:1 [15].
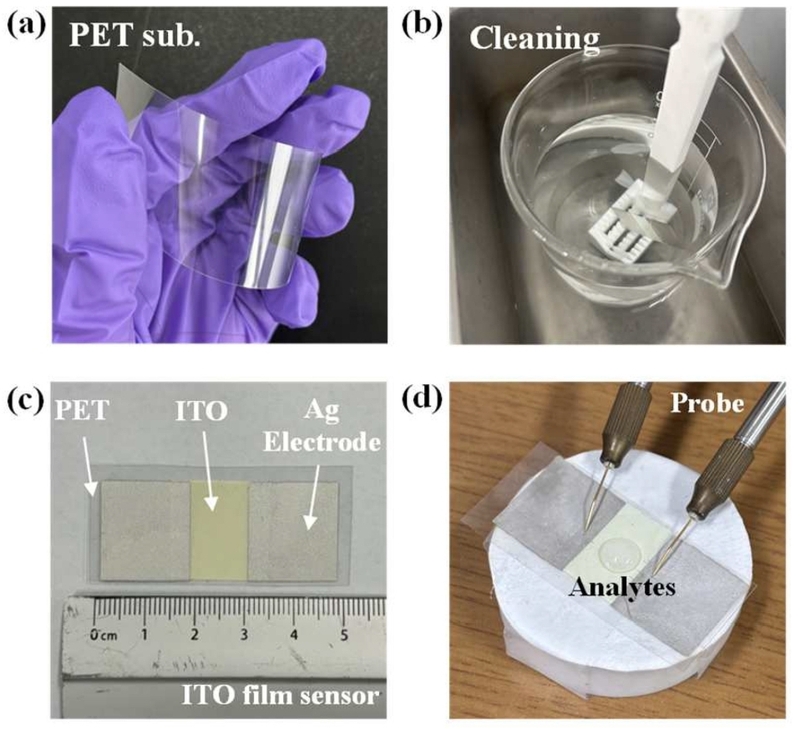
Fabrication procedure of ITO film sensor. (a) PET substrate. (b) Substrate cleaning. (c) Fabricated ITO film sensor. (d) Sensor measurement.
The films were fabricated via a screen-printing method using a mesh mask. The fabricated ITO films had a surface area of 20 × 20 mm2 and a thickness of 11 ± 1 μm. After printing, it is crucial to completely remove any residual binder from the surface to ensure a sufficient contact area between the analyte and the ITO film. α-Terpineol, contained in the organic binder, is known to decompose at temperatures between 80 and 100°C and exhibit hydrophilic properties [16]. Previous studies have also confirmed that the electrical properties of ITO films improve as the heat-treatment temperature increases due to the removal of the organic binder [17]. However, severe substrate deformation occurs at temperatures above 110°C. To prevent such deformation, the heat treatment was performed at 100°C for 3 h. Subsequently, the contact electrodes at both ends of the printed ITO thin film were printed using a commercial Ag paste via screen printing, followed by a thermal curing process at 80°C for 1 h.
Before evaluating the fabricated sensors, the electrical properties, printing accuracy, and mechanical stability of the ITO films were assessed. To evaluate printing accuracy, the dimensions of the fabricated masks were compared with those of the printed films; a dimensional accuracy of approximately 98–102% was confirmed across all fabricated samples. The mechanical properties were evaluated through peeling and bending tests using adhesive tape.
Adhesion between the substrate and the printed thin film is a critical reliability factor in ITO film fabrication. To assess this, a standard tape test was performed by intentionally scratching the surface of the printed film. Cross-hatch cuts were made at 5-mm intervals before applying the tape, and the delaminated area of the ITO film was subsequently measured. The peeled area accounted for approximately 5% of the total area. According to the classification criteria from a previous study [18], this corresponds to a 4B classification grade, indicating sufficient adhesion for sensor applications.
To characterize the electrical properties of the ITO sensor, current-voltage (I-V) measurements were conducted using a source-measure unit (SMU, Keithley 2400). Fig. 1(d) illustrates the measurement setup for sensor operation. These preliminary evaluations provided a foundation for reliable quantitative performance analyses and operational characterizations.
Following fabrication and preliminary testing, the sensor surface was subjected to an additional cleaning process to assess the effects of surface treatment on sensor behavior.
The wettability of the ITO film surface was evaluated by static water contact-angle measurements using a contact angle analyzer (DSA100S, KRÜSS, Germany). DI water was used as the probe liquid, and a 15 μL droplet was placed at the center of the sensor surface. The contact angle was monitored for 10 s, and the mean contact angle over the measurement interval was used to estimate surface energy. The surface-energy values were automatically calculated using the Equation of State (EoS) model implemented in the KRÜSS ADVANCE software. The measurements were performed before and after ultrasonic surface cleaning. Because DI water was used as a single probe liquid, the calculated surface-energy values were treated as comparative estimates rather than absolute surface-energy values. The sensor response characteristics were evaluated using isopropyl alcohol (IPA), a representative organic solvent, diluted in DI water at concentrations ranging from 40 to 160 ppm. To compare sensor performance, 35 µL of the prepared analyte was dropped onto the ITO film surface, and the sensor resistance was measured as a function of time.
Furthermore, to optimize the ITO paste formulation, the binder-to-ITO weight ratio was varied across three conditions: 0.6:1, 0.8:1, and 1.0:1. All samples used for the binder-ratio comparison underwent the same ultrasonic surface-cleaning procedure and were fabricated under identical printing and heat-treatment conditions. Pastes prepared for each condition were used to fabricate sensors under identical printing and heat-treatment processes. The film-formation characteristics and variations in sensor response based on these mixing ratios were then comparatively analyzed to determine the optimal composition.
3. RESULTS AND DISCUSSIONS
Fig. 2 shows the ITO nanoparticles used in this experiment and a histogram of their size distribution, arranged in 5-nm intervals. The size distribution of the nanoparticles and the surface morphology of the ITO sensor were analyzed using FE-SEM (Field Emission Scanning Electron Microscopy). The inset in Fig. 2 presents an FE-SEM image of the ITO film surface, revealing a porous surface morphology after heat treatment. The average particle size determined by FE-SEM was d = 52.8 nm, with a standard deviation of σ = 12.4 nm for a sample size of N = 100 particles. These results are consistent with the values (d = 20–70 nm) provided by the manufacturer, confirming that no significant coarsening occurred during sensor fabrication.
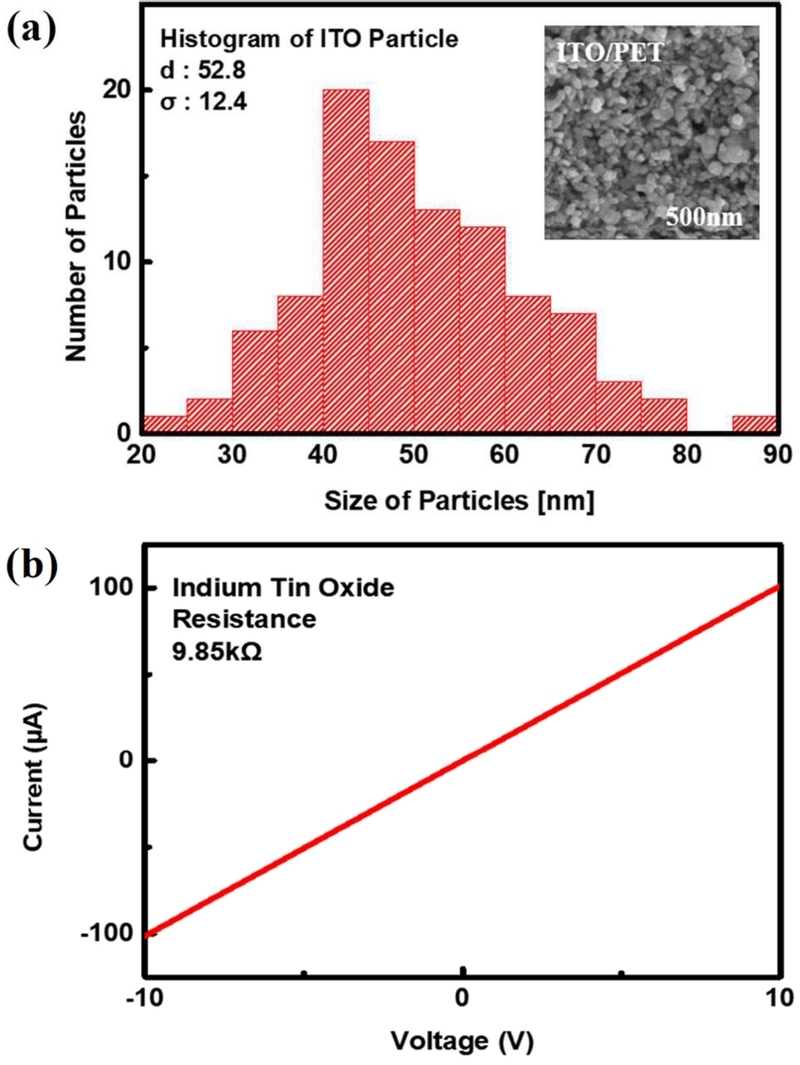
Morphological and electrical properties of the ITO film sensor. (a) Particle size distribution obtained from the FE-SEM image shown in the inset. (b) Current-Voltage characteristics of the ITO film sensor.
Using the method illustrated in Fig. 1(d), probes were brought into contact with the Ag electrodes formed on both sides of the ITO film, and the resistance was measured in air to determine the reference resistance under unstimulated conditions. Fig. 2(b) shows the resistance values of the ITO sensor obtained from current-voltage (I-V) measurements. Under an applied voltage sweep from –10 V to 10 V, the resistance was 9.85 kΩ. This indicates that the fabricated ITO film sensor possesses an appropriate initial resistance; this level helps reduce unnecessary electrical losses during sensor operation and signal acquisition, thereby contributing to the stable acquisition of measurement signals. Therefore, the ITO sensor fabricated in this study is deemed sufficiently suitable for evaluating sensor responses based on its basic electrical characteristics.
The fabricated ITO device was operated as a resistive sensor, and its response was evaluated based on changes in resistance upon contact with IPA-containing aqueous solutions. The observed resistance change may arise from interactions at the liquid–ITO interface that affect charge transport near the ITO surface. In addition, changes in surface wettability and the presence of residual surface species may influence the effective interaction between the analyte solution and the ITO film. Because no reference electrode or direct electrochemical characterization was employed in this study, the detailed interfacial mechanism is considered a conceptual interpretation rather than a conclusively established electrochemical redox process.
For a simplified interpretation of the resistance response, the total resistance of the ITO film can be represented by parallel contributions from the surface resistance (Rs) and bulk resistance (RB). The initial resistance and the resistance after analyte exposure can therefore be expressed as follows:
| (1) |
| (2) |
| (3) |
where R₀ is the initial resistance, RS is the surface resistance, RB is the bulk resistance, and ΔRS represents the change in surface resistance upon analyte exposure. This simplified equivalent-resistance model is used to illustrate how changes occurring near the liquid–ITO interface can affect the measured total resistance and does not establish a specific electrochemical reaction mechanism.
The relationships above imply that ensuring a clean ITO surface is essential for accurate sensor operation. In other words, any residual impurities on the surface can act as sources of unpredictable measurement errors. Therefore, removing these contaminants through an appropriate process is crucial for improving the operational performance and precision of the ITO film sensor. Consequently, as described in the Experimental section, an ultrasonic surface-cleaning process was applied to the fabricated samples.
To investigate the effect of ultrasonic cleaning on the surface properties of the ITO film, Fig. 3 compares the water contact angle and estimated surface energy before and after cleaning. The estimated surface energy increased by 37.8%, from 27.96 mN/m before cleaning to 38.53 mN/m after cleaning, while the water contact angle decreased after cleaning. These changes indicate improved surface wettability after ultrasonic cleaning. Because the surface-energy values were estimated using DI water as a single probe liquid, they are interpreted as comparative indicators rather than absolute surface-energy values. Previous studies have reported that surface treatments can modify the wettability and surface characteristics of ITO [19,20]. These changes are therefore consistent with improved wettability of the ITO surface. The increase in estimated surface energy may be associated with changes in surface condition, including the removal or redistribution of surface contaminants and residual organic species. However, because no direct chemical characterization such as XPS or FTIR was performed, the contact-angle measurements alone cannot conclusively confirm the removal of residual binder.
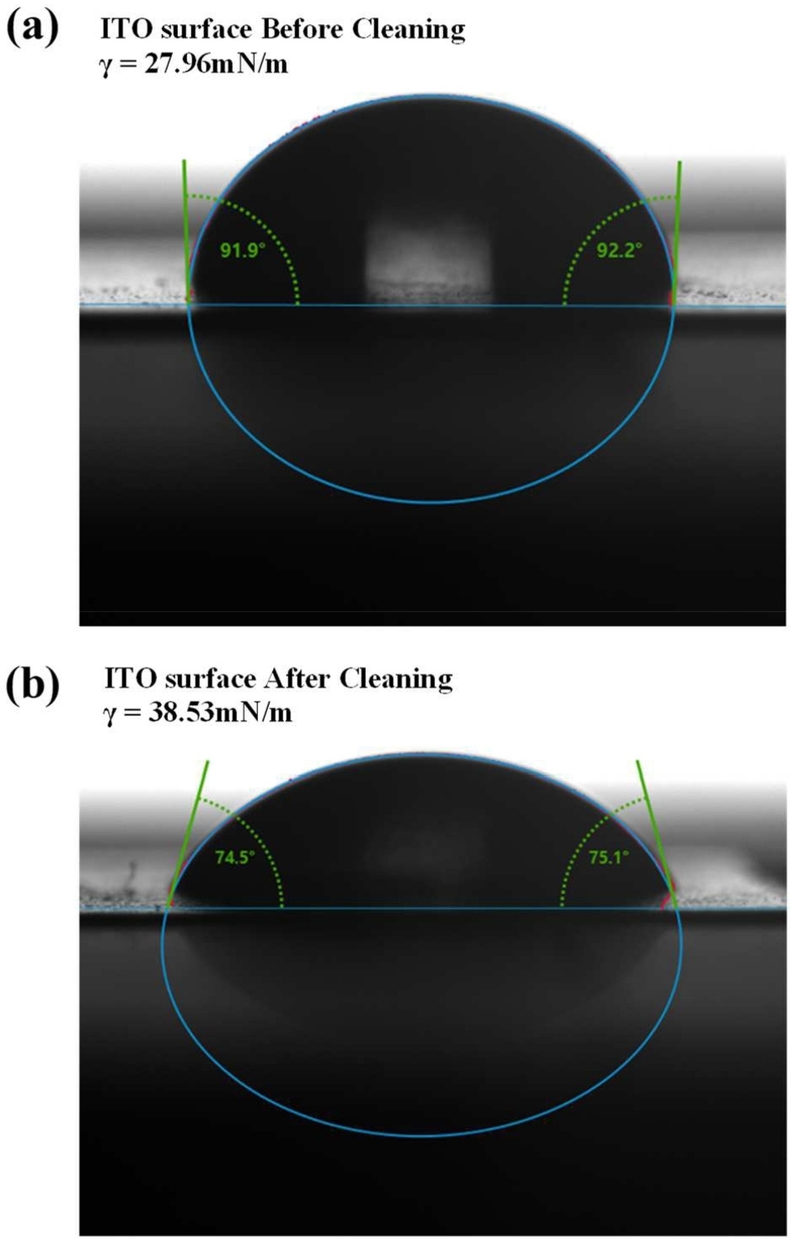
Water contact angle and estimated surface energy of the ITO film sensor. (a) Before surface treatment. (b) After surface treatment.
Fig. 4 illustrates the resistance changes measured at room temperature when the analyte (IPA diluted in DI water) was brought into contact with the fabricated ITO film sensor at concentrations ranging from 40 to 160 ppm. Time-dependent resistance measurements were performed using a Keithley 2400 source-measure unit under a constant DC bias of 1 V. Resistance data were acquired at approximately 0.1 s intervals at room temperature under ambient laboratory conditions, and the 0–1,200 s interval was used to compare time-dependent response characteristics. Relative humidity was not independently controlled or recorded. The same sensor was sequentially used for measurements at different IPA concentrations, and the sensor was dried between consecutive measurements. The response curves in Figs. 4 and 5 represent individual measurement traces and were not obtained by averaging repeated measurements. To minimize measurement variations from positional differences, the analyte droplet was consistently applied to the center of the ITO film.
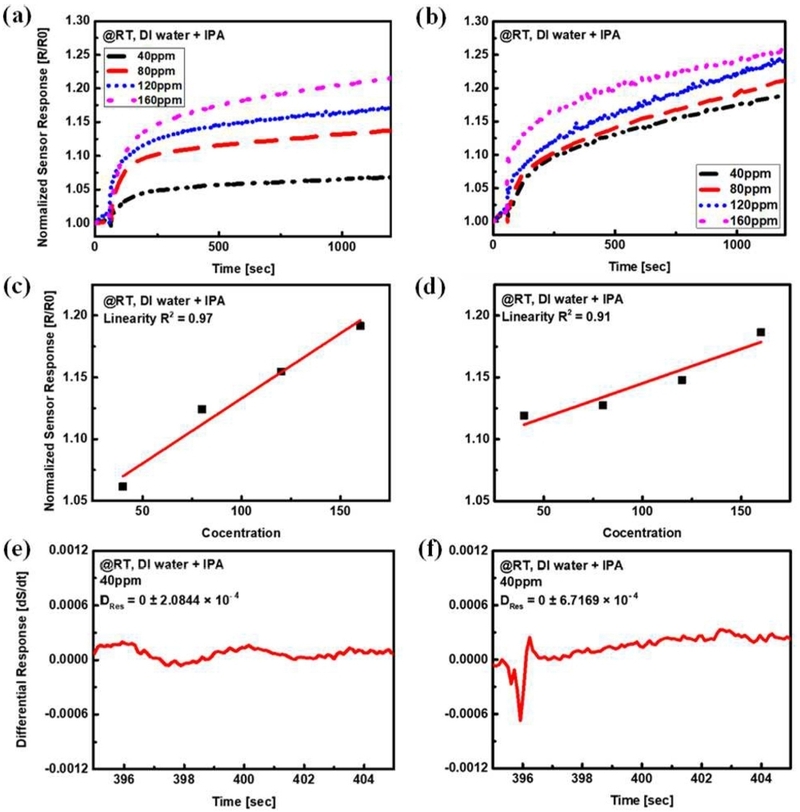
Response characteristics of the printed ITO sensor before and after ultrasonic surface cleaning. (a-b) Time-dependent normalized sensor responses at IPA concentrations ranging from 40 to 160 ppm (a) after ultrasonic surface cleaning and (b) before ultrasonic surface cleaning. (c-d) Concentration-dependent sensor responses (c) after ultrasonic surface cleaning and (d) before ultrasonic surface cleaning. (e-f) Differential response characteristics at 40 ppm (e) after ultrasonic surface cleaning and (f) before ultrasonic surface cleaning.
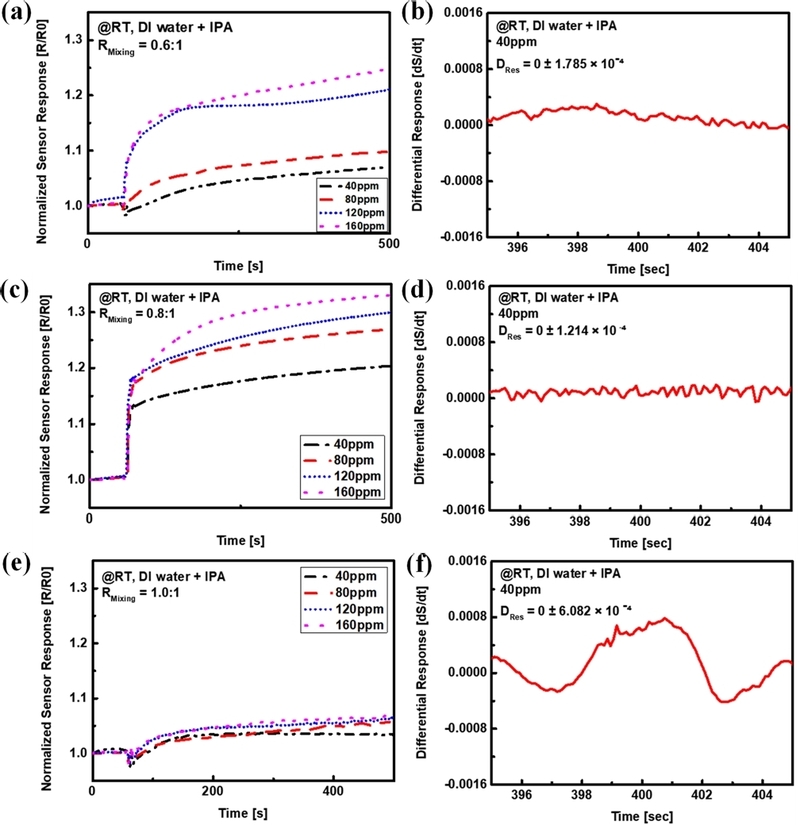
Changes in sensor response characteristics according to binder-to-ITO mixing ratio (RMixing). Time-dependent sensor responses at different concentrations ((a) RMixing 0.6:1, (c) RMixing 0.8:1, (e) RMixing 1.0:1) and differential response characteristics over time ((b) RMixing 0.6:1, (d) RMixing 0.8:1, (f) RMixing 1.0:1).
The parameters characterizing the sensor operation were defined as follows: the normalized sensor response (S) was defined as the ratio of the resistance after analyte application (R) to the initial baseline resistance (R₀), expressed as S = R/R₀. For response-time analysis, the time of analyte application was defined as t = 0 s. The response time (t₉₀) was defined as the time required for the normalized sensor response to reach 90% of the total response change from the initial baseline response (S₀) to the final response (Sf). The final response (Sf) was defined as the average normalized response during the final 60 s of the measurement. Accordingly, t90 was determined as the time at which S(t90) = S0 + 0.90(Sf − S0). Response linearity was evaluated by using the coefficient of determination (R2) obtained by linearly fitting the response magnitudes across the different concentrations.
Furthermore, the differential characteristics of the time-response curve were analyzed as an indicator of sensor response stability. The differential-response analysis was performed using normalized sensor response data within the 395–405 s interval after analyte application. The temporal derivative (dS/dt) was calculated using Origin, and the fluctuation range was quantified as the difference between the maximum and minimum dS/dt values within this interval. A smaller fluctuation range indicates lower short-term variation in the sensor response and, consequently, greater response stability.
Figs. 4(a) and 4(b) illustrate the time-dependent response characteristics of the samples at various concentrations after and before ultrasonic surface cleaning, respectively. For a quantitative comparison of response time, the 40 ppm condition was selected, consistent with the differential-response analysis in Figs. 4(e) and 4(f). At 40 ppm, the untreated sample exhibited a continuously increasing response during the measurement period, whereas the cleaned sample approached a more stable response. The t90 decreased from approximately 1,120 s before cleaning to approximately 750 s after cleaning, corresponding to a reduction of approximately 33%.
Fig. 4(c) shows the response linearity after ultrasonic surface cleaning, with an R2 value of 0.97, whereas Fig. 4(d) shows the response linearity before ultrasonic surface cleaning, with an R2 value of 0.91.
Figs. 4(e) and 4(f) show the differential-response characteristics at 40 ppm after and before ultrasonic surface cleaning, respectively. Within the 395–405 s analysis interval, the differential-response fluctuation range decreased from approximately 6.7169 × 10⁻⁴ s-1 before cleaning to 2.0844 × 10⁻⁴ s-1 after cleaning.
Because DI water was used for the ultrasonic cleaning process, the observed improvement is likely associated with changes in surface condition, including the removal or redistribution of surface contaminants. The decrease in water contact angle observed after cleaning is consistent with improved surface wettability. Residual organic binder may contribute to these changes; however, its removal was not directly confirmed by chemical surface analysis in this study. To further examine the influence of binder content, sensors were fabricated using binder-to-ITO mixing ratios of 0.6:1, 0.8:1, and 1.0:1 under identical printing and heat-treatment conditions.
Fig. 5 compares the response characteristics of the sensors fabricated with these different binder-to-ITO mixing ratios. Fig. 5(a) presents the time-dependent response curve for the 0.6:1 mixing ratio, while Fig. 5(b) illustrates the differential response characteristics at a concentration of 40 ppm around 400 seconds. As shown in Fig. 5(a), although the response increased with rising concentration, it did not stabilize sufficiently within the measurement period and continued to rise. Notably, at 120 ppm, the sensor response continued to increase, exceeding approximately 1.20, and did not reach stable saturation even after 500 s. Additionally, at 40 ppm, the response magnitude was relatively low (approximately 1.069), and the response time exceeded 500 s, making it the slowest response among the three evaluated conditions. Regarding response linearity, although a concentration-dependent increasing trend was confirmed, it yielded a relatively low coefficient of determination (R² = 0.88). This indicates relatively poor response linearity, which may be associated with the incomplete saturation behavior observed within the measurement period. Furthermore, as shown in Fig. 5(b), the differential-response fluctuation range was 1.785 × 10⁻⁴ s⁻¹, indicating insufficient response stability.
Fig. 5(c) presents the response characteristics of the sensor fabricated with a 0.8:1 mixing ratio, while Fig. 5(d) illustrates the differential response characteristics of this sample at 40 ppm. As observed in Fig. 5(c), the rate of response change gradually decreased after approximately 200–250 s, approaching stable saturation behavior. Furthermore, the response magnitude distinctly increased with rising concentration, demonstrating excellent concentration dependence. The concentration-dependent increase in response may reflect changes in the interaction between the IPA-containing solution and the ITO surface, which can influence charge transport and the measured resistance of the film. At 40 ppm, the sensor exhibited a response magnitude of approximately 1.15, the highest among the three evaluated conditions. The response linearity was also highest, yielding an R² of 0.95 and indicating the strongest linear concentration dependence among the three conditions. Finally, in Fig. 5(d), the differential-response fluctuation range was 1.214 × 10⁻⁴ s⁻¹, the smallest among the three conditions, confirming that the 0.8:1 mixing ratio provides the most stable sensor response.
Fig. 5(e) presents the time-dependent response curve for the 1.0:1 mixing ratio, while Fig. 5(f) illustrates the differential response characteristics of this sample at 40 ppm. As shown in Fig. 5(e), although the response appeared to converge at a certain level, the overall response magnitude was small. Furthermore, the range of variation with increasing concentration was limited, indicating reduced concentration resolution. The sensor response plateaued at approximately 1.05, showing the lowest response among the three evaluated conditions, and the response difference across concentrations was largely insignificant. Specifically, the response magnitude at 40 ppm was approximately 1.033, the lowest value observed. Response linearity was also lowest, with a coefficient of determination (R²) of 0.81, confirming reduced response resolution to concentration changes. Additionally, as depicted in Fig. 5(f), the differential-response fluctuation range was 6.082 × 10⁻⁴ s⁻¹, indicating the highest noise level and the lowest response stability among the three conditions.
In summary, the binder-to-ITO mixing ratio was closely associated with the saturation behavior and temporal response stability of the sensor. Among the tested conditions, the 0.8:1 ratio exhibited the most stable saturation response and the smallest differential-response variation, whereas the 0.6:1 condition showed incomplete saturation and the 1.0:1 condition exhibited larger signal fluctuations. These results indicate that controlling binder content is important for achieving stable response characteristics in printed ITO sensors.
4. CONCLUSIONS
In this study, we investigated the effects of electrode surface conditions on the response characteristics of printed ITO-based electrochemical sensors by monitoring resistance changes upon analyte exposure. Ultrasonic surface cleaning decreased the water contact angle of the ITO film, indicating improved surface wettability. At 40 ppm, the response time (t₉₀) decreased from approximately 1,120 s before cleaning to approximately 750 s after cleaning, corresponding to a reduction of approximately 33%. In addition, the concentration-dependent response linearity improved from R² = 0.91 before cleaning to R² = 0.97 after cleaning, while the differential-response fluctuation range at 40 ppm decreased after cleaning, indicating improved temporal response stability.
The effect of the binder-to-ITO mixing ratio was also investigated using ratios of 0.6:1, 0.8:1, and 1.0:1. Among the tested conditions, the 0.8:1 ratio exhibited the most stable saturation behavior and the lowest differential-response variation, whereas insufficient or excessive binder contents resulted in incomplete saturation or increased signal fluctuations, respectively. These results indicate that ultrasonic surface cleaning and appropriate control of the binder-to-ITO mixing ratio are important for improving the response characteristics and stability of printed ITO-based electrochemical sensors.
Acknowledgments
This research received no external funding.
REFERENCES
-
W. Tsujita, A. Yoshino, H. Ishida, T. Moriizumi, Gas sensor network for air-pollution monitoring, Sens. Actuators B Chem. 110 (2005) 304–311.
[https://doi.org/10.1016/j.snb.2005.02.008]

-
A. Bieganowski, G. Józefaciuk, L. Bandura, Ł. Guz, G. Łagód, W. Franus, Evaluation of Hydrocarbon Soil Pollution Using E-Nose, Sensors 18 (2018) 2463.
[https://doi.org/10.3390/s18082463]
-
F. Attivissimo, C. Guarnieri Calò Carducci, A. Lanzolla, A. Massaro, M. Vadrucci, A Portable Optical Sensor for Sea Quality Monitoring, IEEE Sens. J. 15 (2015) 146–153.
[https://doi.org/10.1109/JSEN.2014.2340437]
-
P.K. Kalambate, S. Mane, S.S. Upadhyay, R.P. Kalambate, N.S. Gadhari, E. Sivasurya, et al., Advances in electrochemical sensors for monitoring of emerging soil contaminants: Innovations, challenges, and environmental impact, Trends Anal. Chem. 194 (2026) 118503.
[https://doi.org/10.1016/j.trac.2025.118503]
-
W.-D. Huang, H. Cao, S. Deb, M. Chiao, J.C. Chiao, A flexible pH sensor based on the iridium oxide sensing film, Sens. Actuators A Phys. 169 (2011) 1–11.
[https://doi.org/10.1016/j.sna.2011.05.016]
-
A. Kumlanghan, P. Kanatharana, P. Asawatreratanakul, B. Mattiasson, P. Thavarungkul, Microbial BOD sensor for monitoring treatment of wastewater from a rubber latex industry, Enzyme Microb. Technol. 42 (2008) 483–491.
[https://doi.org/10.1016/j.enzmictec.2008.01.012]
-
H. Rügner, M. Schwientek, B. Beckingham, B. Kuch, P. Grathwohl, Turbidity as a proxy for total suspended solids (TSS) and particle facilitated pollutant transport in catchments, Environ. Earth Sci. 69 (2013) 373–380.
[https://doi.org/10.1007/s12665-013-2307-1]
-
Y. Zhuang, W. Wen, S. Ruan, F. Zhuang, B. Xia, S. Li, et al., Real-time measurement of total nitrogen for agricultural runoff based on multiparameter sensors and intelligent algorithms, Water Res. 210 (2022) 117992.
[https://doi.org/10.1016/j.watres.2021.117992]
-
H. Chen, L. Zhao, F. Yu, Q. Du, Detection of phosphorus species in water: technology and strategies, Analyst 144 (2019) 7130–7148.
[https://doi.org/10.1039/C9AN01161G]
-
S. An, C. Lee, Y. Cho, J. Chang, J. Park, M. Lee, Study on the accuracy of Indium-Tin-Oxide (ITO) nanoparticle sensor based on solvent detection characteristics in water, J. Korean Phys. Soc. 85 (2024) 861–866.
[https://doi.org/10.1007/s40042-024-01176-7]
-
D. Ko, J. Choi, J. Seo, J. Noh, S. Lee, J.-Y. Jung, et al., Chemical sensing properties of indium-tin-oxide (ITO) printed films fabricated on biodegradable plastics, AIP Adv. 10 (2020) 045228.
[https://doi.org/10.1063/1.5141018]
-
R. Singh, R. Gupta, D. Bansal, R. Bhateria, M. Sharma, A Review on Recent Trends and Future Developments in Electrochemical Sensing, ACS Omega 9 (2024) 7336–7356.
[https://doi.org/10.1021/acsomega.3c08060]
-
S. Lee, J.-Y. Jung, M. Lee, J. Chang, An Aqueous Ammonia Sensor Based on Printed Indium Tin Oxide Layer, Sens. Mater. 29 (2017) 57–63.
[https://doi.org/10.18494/SAM.2017.1375]
-
S. An, J. Noh, C. Lee, S. Lee, D. Seo, M. Lee, et al., Study On the Effect of the Electrode Structure of an ITO Nanoparticle Film Sensor On Operating Performance, J. Sens. Sci. Technol. 31 (2022) 90–95.
[https://doi.org/10.46670/JSST.2022.31.2.90]
-
J. Koo, S. Lee, S. Cho, J. Chang, Effect of Additives on the Properties of Printed ITO Sensors, J. Korean Phys. Soc. 71 (2017) 335–339.
[https://doi.org/10.3938/jkps.71.335]
-
F. Shafizadeh, A.G.W. Bradbury, Thermal degradation of cellulose in air and nitrogen at low temperatures, J. Appl. Polym. Sci. 23 (1979) 1431–1442.
[https://doi.org/10.1002/app.1979.070230513]
- B. Demirel, A. Yaraş, H. Elcicek, Crystallization Behavior of PET Materials, BAÜ Fen Bil. Enst. Dergisi 13 (2011) 26–35.
- K.-Y. Shin, M.K. Kim, S.-H. Lee, J.Y. Hwang, H. Kang, K. Kang, Reliability Evaluation of Silver Patterns Using Ink-jet Printing Technology, Proceedings of the 39th KIEE Summer Conference, South Korea, 2008, p. 392.
-
J.S. Kim, R.H. Friend, F. Cacialli, Surface energy and polarity of treated indium–tin–oxide anodes for polymer light emitting diodes studied by contact-angle measurements, J. Appl. Phys. 86 (1999) 2774–2778.
[https://doi.org/10.1063/1.371124]
-
S.Y. Kim, J.-L. Lee, K.-B. Kim, Y.-H. Tak, Effect of ultraviolet–ozone treatment of indium–tin–oxide on electrical properties of organic light emitting diodes, J. Appl. Phys. 95 (2004) 2560–2563.
[https://doi.org/10.1063/1.1635995]