FPGA Implementation of an Artificial Intelligence Signal Recognition System
This is an Open Access article distributed under the terms of the Creative Commons Attribution Non-Commercial License(https://creativecommons.org/licenses/by-nc/3.0/) which permits unrestricted non-commercial use, distribution, and reproduction in any medium, provided the original work is properly cited.
Abstract
Cardiac disease is the most common cause of death worldwide. Therefore, detection and classification of electrocardiogram (ECG) signals are crucial to extend life expectancy. In this study, we aimed to implement an artificial intelligence signal recognition system in field programmable gate array (FPGA), which can recognize patterns of bio-signals such as ECG in edge devices that require batteries. Despite the increment in classification accuracy, deep learning models require exorbitant computational resources and power, which makes the mapping of deep neural networks slow and implementation on wearable devices challenging. To overcome these limitations, spiking neural networks (SNNs) have been applied. SNNs are biologically inspired, event-driven neural networks that compute and transfer information using discrete spikes, which require fewer operations and less complex hardware resources. Thus, they are more energy-efficient compared to other artificial neural networks algorithms.
Keywords:
Electrocardiogram, Pattern Recognition, Spiking Neural Network, Deep Learning1. INTRODUCTION
Electrocardiogram (ECG) signals, one of the most prevalent and commonly used signals in the medical field [1], represent the electrical activity of the heart that can be captured by non-invasive techniques.
An ECG is characterized by distinct morphologies, namely P-wave, QRS complex, and T-wave. The P-wave indicates the depolarization of the left and right atriums, and corresponds to atrial contraction, which is smooth and rounded, with a maximum of 2.5 mm in height and 0.11 s in width.
The QRS complex consists of three parts, Q-wave, R-wave, and S-wave, which start before ventricular contraction. These parts occur in rapid succession. Electrical impulses spread through the ventricles and indicate ventricular depolarization, represented by the QRS complex. The measurement should be 0.12–0.20 s and the amplitude of a normal QRS ranges between 5–30 mm.
The T-wave represents ventricular repolarization, which occurs after the QRS complex. Regularly, the T-wave follows the direction of the preceded QRS complex. When the T-wave shows a different direction of its preceded QRS complex, it indicates a cardiac pathology. A normal T-wave usually has an amplitude of less than 10 mm in the case of limb leads. Fig. 1 shows a normal ECG waveform consisting of P-wave, QRS complex, T-wave and sometimes U-waves.
An arrhythmia is an irregularity of the heart rate and rhythm. It means that the heart beats too quickly (tachycardia), too slowly (bradycardia), or with an irregular pattern.
Generally, arrhythmia analysis is a complex task due to the high variability of the mechanism of the heart inside each patient. Arrhythmias are classified into two classes:
- ① Rhythmic: comprised of a series of irregular beats
- ② Morphological: single abnormal beat
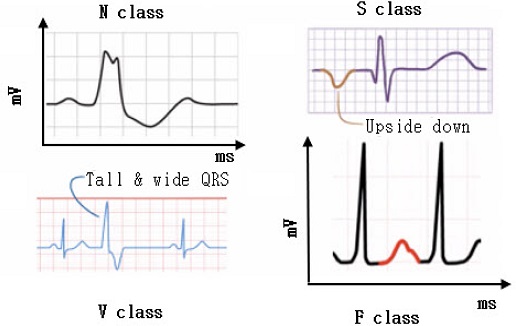
Most of the literature focuses on the morphological class. Arrhythmias of the morphological class are classified into four macro classes by the Association for the Advancement of Medical Instrumentation (AAMI) standard, concerning the location where the anomaly begins [2]. Fig. 2 shows examples of arrhythmias classified by AAMI, where the horizontal axis represents time in milliseconds (ms) and the vertical axis represents amplitude or voltage in millivolts (mV). Table 1 shows the Detailed classification of arrhythmias
N-class: It happens when the beat regularly starts at the sinoatrial (SA) node but can be blocked in the left or right bundle branches. For example, the left bundle branch block happens when the impulse does not reach the left ventricle because the left bundle is compromised; in this case, the right ventricle depolarizes, followed by the left one. This results in a QRS complex longer than 120 ms.
S-class: It happens when the impulse starts below the SA node; in this scenario the impulse begins at the bottom and subsequently reaches the upper part, resulting in an upside-down P-wave.
V-class: It occurs when the impulse originates in the ventricles and appears in the ECG as a tall and wide QRS.
F-class: It happens when there are multiple sources of depolarization; for example, in Fig. 2 the P-wave is modified by an additional source of depolarization.
Spiking neural networks (SNNs), which are biologically inspired, event-driven neural networks, have been used to achieve faster and more power-efficient neural networks for detection. SNNs compute and transfer information using discrete spikes that require fewer operations and less complex hardware resources, making them energy-efficient compared to other artificial neural network (ANN) algorithms.
The proposed SNN was trained on PTB Diagnostic Dataset, which consists of normal and abnormal ECG signals, and the inference was performed on a field programmable gate array (FPGA) board.
2. ECG PRE-PROCESSING AND ECG CLASSIFICATION METHODS
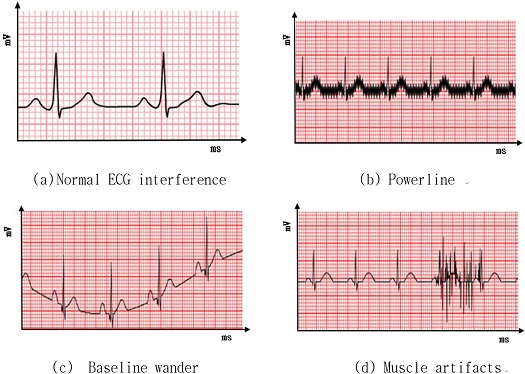
Usually, an acquired ECG signal contains considerable information in the form of noise, which can be of different types, as shown in Fig. 3, where the x- and y-axes represent time and amplitude, respectively.
Powerline interference is one of the most disturbing noise sources that hamper the analysis of electrical signals generated by the human body. Baseline wander is a low-frequency artifact in the ECG that arises from breathing, electrically charged electrodes, or subject movement and can hinder the detection of these ST changes. Muscle artifacts are usually caused by line current, which has a frequency of 50 Hz or 60 Hz.
These types of noises can be removed by further preprocessing using averaging and adaptive filters from an ECG data strip.
After preprocessing, ECG data can be further examined to observe normal and irregular activities. To accurately detect arrhythmias, different methods have been used in the past decades, which can be categorized as supervised and unsupervised learning techniques.
3. SPIKING NERRAL NETWORK
SNNs are highly powerful and biologically realistic ANNs inspired by the dynamics of the human brain [3].
Spiking is a manner to encode digital communications over a long distance (the spike rate and timing of individual spikes relative to others are the variations by which a spiking signal is encoded) because analog values are destroyed when sent to a long-distance over an active medium [4,5]. SNNs are also known as the third-generation neural networks.
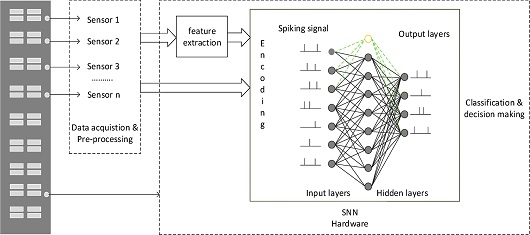
The current state-of-art methods are designed using ANNs. Despite their higher accuracy, ANNs require significant computational resources and power. Thus, SNNs are an alternative to ANNs for the existing artificial intelligence (AI) algorithms. The basic network of SNNs is shown in Fig. 4. A dense network of neurons is interconnected by synapses. Neurons communicate with each other by transmitting impulses.
Network elements of SNN are as follows:
- • Neuron
- • Synapse
- • Receptive field
- • Spike train
Neurons are the basic building blocks of an SNN; there are several interconnected neurons from the input, hidden, and output layers. Some of the characteristics of the leaky-integrate-and-fire (LIF) neuron are as follows:
- • In the absence of stimulus, the membrane has a resting potential. Every input spike from connected neurons increases or decreases the membrane potential;
- • When the potential crosses a threshold value, the neuron enters a refractory period in which no new input is allowed, and the potential remains constant;
- • To avoid a strong negative polarization of the membrane, its potential is limited by Pmin;
- • As long as Pn>Pmin, there is a constant leakage of potential l.
Synapse is a junction between two nerve cells, as described in the neurobiology, consisting of a minute gap across which an impulse passes by diffusion of a neurotransmitter. In an SNN, the synapse is the weighted path for generated spikes from one neuron to the other connected neurons. An example is shown in Fig. 4 for a three-layer SNN. Each neuron in the first layer is connected to all neurons in the second layer via a synapse. Synapses are realized by a two-dimensional matrix of size (5×3) initialized with random weights. This provides a framework for SNN with learned weights such that it can be used for classification (or prediction) and can be expanded to any number of layers with any number of neurons in it.
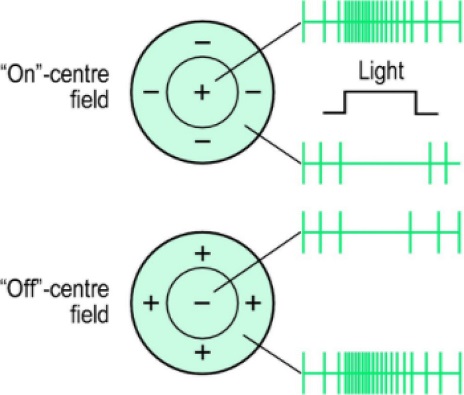
The receptive field is an area in which simulation leads to a response of a particular sensory neuron. In the case of SNNs, where the input is an image, the receptive field of a sensory neuron is the part of the image that increases the membrane potential. In this study, an on-centered receptive field was used, as shown in Fig. 5.
The receptive field is an area in which simulation leads to a response of a particular sensory neuron. In the case of SNNs, where the input is an image, the receptive field of a sensory neuron is the part of the image that increases the membrane potential. In this study, an on-centered receptive field was used, as shown in Fig. 5.
Spike trains are the inputs of the input neuron layer that have to be fed with the stimulus caused by their receptive field. Stimulus calculated from the sliding window is an analog value and has to be converted into a spike train to be understood by neurons. This encoding technique serves as an interface between numerical data (from the physical world, digital simulations, etc.) and SNNs. It converts the information to artificial neuron spikes. More about spike trains will be explained briefly in the encoding part.
Considering the important aspects of SNNs, spike-time dependent plasticity (STDP) has a major role in learning the weights and can be used to classify the patterns [6].
Several STDP algorithms were tested to compare the robustness of the chosen architecture. In this work, the STDP rule uses an exponential weight dependence to compare the weight change, as in Equation (1).
| (1) |
where β determines the strength of weight dependence.
Specifically, STDP is a biological process used by the brain to modify synapses, using two basic rules to model the weights:
- 1. A synapse that contributes to the firing of a post-synaptic neuron should be strengthened (more weight);
- 2. A synapse that does not contribute to the firing of a postsynaptic neuron should be weakened (less weight).
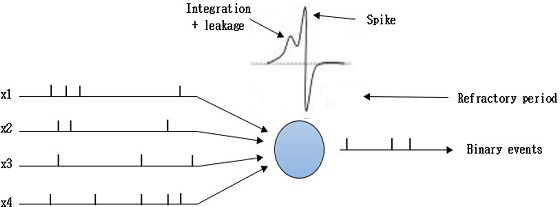
Fig. 6 depicts the mechanism of the algorithm. Let us consider four neurons that connect to a single neuron by synapses. Each pre-synaptic neuron is firing at its own rate and the spikes are sent forward by the corresponding synapse. Here, the input spikes membrane potential of the postsynaptic neuron increases and sends out a spike after crossing the threshold. When the postsynaptic neuron spikes, all the pre-synaptic neurons that helped to fire can be monitored by observing which presynaptic neurons sent out spikes before the postsynaptic neuron spiked. This procedure helps in postsynaptic spike by increasing the membrane potential and strengthening the corresponding synapse.
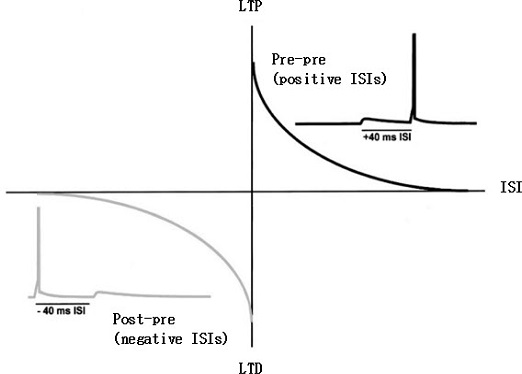
The factor by which the weight of synapse is increased is inversely proportional to the time difference between postsynaptic and presynaptic spikes and given by the graph in Fig. 7.
In summary, the difference between ANNs and SNNs is shown in Fig. 8. Inspired by this observation, SNNs have been introduced in the theoretical neuroscience literature as networks of dynamic spiking neurons that enable efficient on-line inference learning [7]. SNNs have the unique capability to process information encoded in the timing of spikes, with the energy per spike of few picojoules. The most common model consists of a network of neurons with a deterministic dynamics (e.g., LIF model, whereby a spike is emitted as soon as an internal state variable, known as membrane potential, crosses a given threshold value).
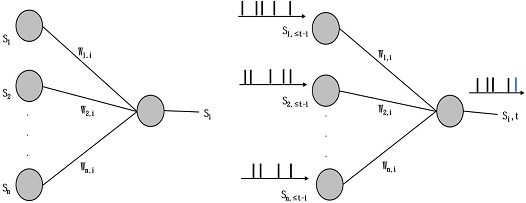
Neural networks: (left) an ANN, where each neuron processes real numbers; (right) an SNN, where dynamic spiking neurons process and communicate binary sparse spiking signals over time.
The neuron model used is the LIF neuron for the SNN architecture, which will be discussed below.
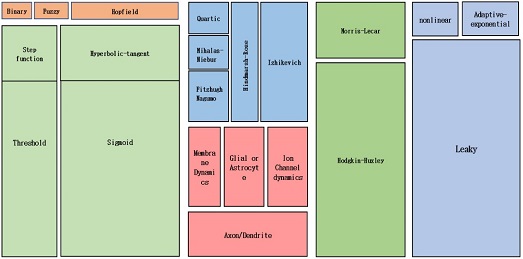
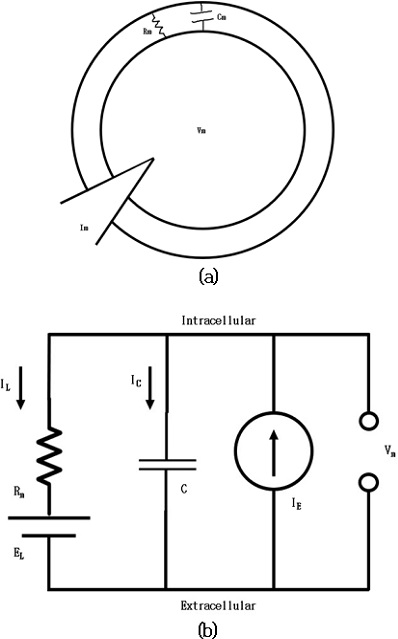
Fig. 9 shows the classification of different neuron models [8]. For this study, the major focus was on LIF neuron model. Neuronal dynamics can be conceived as a summation process (called ‘integration’) combined with a mechanism that triggers action potentials above some critical voltage. As observed in Fig. 10 (a), the neuron membrane can be depicted as a capacitor with a resistor, which causes leakage. The input spikes cause the accumulation of charge in the capacitor and leaking through the resistor. Fig. 10 (b) shows an RC circuit.
The cell membrane acts as an electrical insulator between the intracellular and extracellular fluids, which are two conductors. This creates a capacitor, accumulating charge through the membrane that can be integrated over time. The accumulated charge creates a voltage difference across the membrane (Vm).
To summarize:
- • The cell has a single voltage, Vm
- • The membrane has a capacitance Cm
- • The membrane leaks charge through Rm
- • The charge carriers are driven by Ve
Spike occurs when Vm exceeds some threshold value Vth . When a spike occurs, the voltage is artificially dropped to a value Vreset . The model formulation used is given by Equation (2).
| (2) |
Table 2 shows the constants used for the LIF neuron. The SNN architecture was first tested on the Modified National Institute of Standards and Technology database, providing good accuracy when implemented on software. Thus, the same python modules were ported and optimized for the ECG signal classification to test the applicability of the architecture.
4. EXPERIMENTAL RESULTS
4.1 ECG Dataset
The dataset used for the simulation results is taken from the Physio net Bank named as “PTB Diagnostic ECG Database” [9].
The PTB Diagnostic ECG Database consists of:
- • Number of samples: 14552
- • Number of categories: 2 (Normal vs Abnormal)
- • Sampling frequency: 125 Hz
- • Data source: Physio net’s PTB Diagnostic Database.
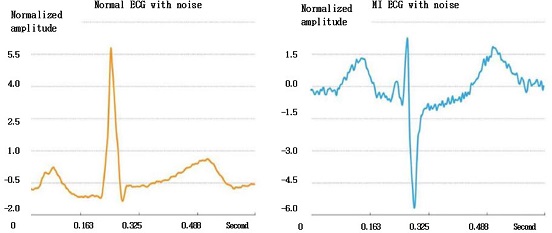
Normal and Abnormal Myocardial Infarction (MI): MI is one of the most threatening cardiovascular diseases for human beings. It is caused by myocardial insufficient blood supply or even myocardial necrosis due to coronary occlusion. According to statistics, in the early stage of this disease, patients usually show symptoms such as chest pain and chest tightness, but some patients have no evident symptoms. With the rapid advancement of wearable devices and portable ECG medical devices, it is possible and conceivable to detect and monitor MI ECG signals. Fig. 11 shows a sample of segmented normal and abnormal ECG signals from PTB Diagnostic with and without noise. A total of 1000 images for normal and 1000 for abnormal (MI) signals were used for the experiments.
4.2 Development Tools
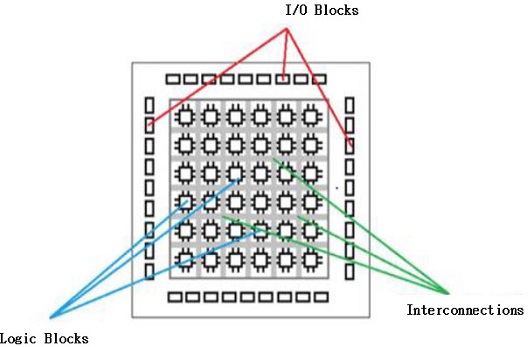
Fig. 12 shows the basic structure of the FPGA. The first FPGA was introduced by Xilinx in 1985. It has lots of logic blocks which are connected by interconnecting and switch matrix units. Logic block mainly consists of a Look-up table (LUT) and Flip-Flops (FF). LUTs are used for performing logic operations and FFs store the results of LUTs. But with the progress in times, FPGAs are becoming complex nowadays.
In this paper, high-level synthesis (HLS), provided by Xilinx, was used. HLS is an automated design process that transforms high-level functional specifications, generally in c/C++ or SystemC, to optimize register-transfer level (RTL) descriptions for efficient hardware implementations [38]. HLS works as a bridge between hardware and software, providing the following benefits:
- • Improves productivity for hardware designers. It provides flexibility to the hardware designer to work at a higher level of abstraction while creating high-performance hardware;
- • Enables the development of different multi-architectural solutions without changing the C specifications. This also enables design space explorations and helps identifying the optimal implementation;
- • Improves system performance for software designers. They can accelerate the intensive parts of their algorithms, which requires considerable computation, on a target that is FPGA.
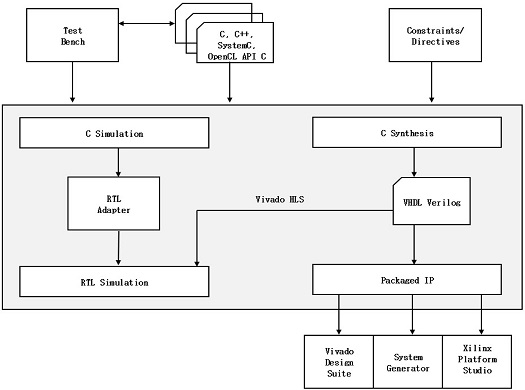
The design flow of Vivado HLS is shown in Fig. 13 and can be explained as follows:
- • Compile, execute, and debug the C algorithm. In HLS, the program written in C language is compiled, the algorithm simulates the function to validate whether it is functionally correct. This C function is the primary input to Vivado HLS;
- • Synthesis of the C algorithm into RTL implementation. Optimization directives and constraints can be added to direct the synthesis process to implement a specific optimization;
- • Generate reports about hardware resource utilization to timing and analyze the design in all aspects;
- • Verify the RTL implementation using a pushbutton flow. Vivado HLS uses the C test bench to simulate the C function before synthesis and to verify the RTL output using C/RTL Co-simulation;
- • Package the RTL implementation into a selection of IP packages.
The most important part of the hardware accelerator design as the C code is the translation to RTL code, which can be in VHDL or Verilog depending on the user preference. To perform implementation on the accelerator, PYNQ-Z2 was chosen as a targeted embedded platform. The modeled SNN using LIF neuron was implemented as an SNN hardware accelerator on a programmable system on chip with an FPGA and a general-purpose processor on the same chip. The hardware resources present on the board are shown in Table 3. All the python modules of software implementation were converted into C language for inference and synthesized in Vivado HLS for pre-synthesis results.
Table 4 presents the evaluation of the speedup attained over software implementation on the ARM processor for normal and abnormal ECG images. The overall speedup on the hardware accelerator was 30× improved over the software implementation on the ARM processor. Hence, the hardware execution time was considerably faster than that of the software.
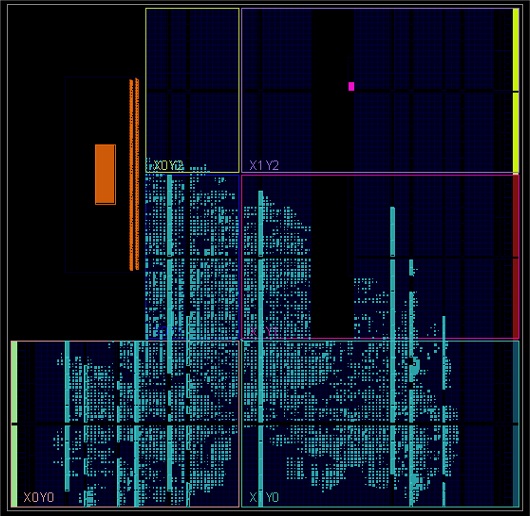
The simulation was conducted on all 1000 images of normal and abnormal ECGs and the overall execution time was calculated based on inferencing the respective images. From the simulation on PC/laptop, the proposed SNN attained a 2× improvement compared to the baseline SNN model. Thus, the best input image dimension was selected based on both the hardware and software perspectives. As larger images were not compatible while inferencing in FPGA, smaller images were chosen for comparison for both hardware and software. Fig. 14 shows the implementation of the design on the FPGA. Table 5 presents the evaluation of latency, memory, and accuracy for the convolutional neural network (CNN) and SNN. The SNN showed results comparable to those of the CNN, which can be further improved in future research.
5. Conclusion
In this study, we implemented an artificial intelligence signal recognition system in FPGA that can recognize patterns of bio-signals such as EEG in edge devices that require batteries. Despite the increment in classification accuracy, deep learning models require exorbitant computational resources and power. This makes the mapping of deep neural networks slow and implementation on wearable devices challenging. To overcome these limitations, SNNs have been applied. SNNs are biologically inspired, event-driven neural networks that compute and transfer information using discrete spikes that require fewer operations and less complex hardware resources. Thus, they are more energy-efficient compared to other ANN algorithms. Future works will focus on the number of classes of arrhythmias to more than two and solve the complexity of hardware-level feature detection in detail.
The low-power and high performance characteristics of the SNN algorithm enable its use with other low power devices for long-term healthcare monitoring applications. The SNN algorithm has a strong potential to be integrated into future wearable devices for the improvemet of human health. There is a growing belief that SNNs may easily enable low-power hardware evaluation.
Acknowledgments
This research was supported by Basic Science Research Program through the National Research Foundation of Korea(NRF) funded by the Ministry of Education(NRF-2021R1F1A1064351). The EDA tool was supported by the IC Design Education Center.
REFERENCES
- T. T. Habte, H. Saleh, B. Mohammad, and M. Ismail, Ultra Low Power ECG Processing System for IoT Devices: Analog Circuits and Signal Processing, Springer International Publishing, USA, pp. 13-26, 2019.
- A. Catalani, “Arrhythmia Classification from ECG signals”, Master Thesis, University of Rome, 2019.
- https://towardsdatascience.com/spiking-neural-networks-the-next-generation-of-machine-learning-84e167f4eb2b, (retrieved on Jan, 11, 2018).
- https://wiki.pathmind.com/neural-network, (retrieved in 2020).
-
A. R. Young, M. E. Dean, J. S. Plank, and G. S. Rose, “A Review of Spiking Neuromorphic Hardware Communication System”, IEEE Access, Vol. 7, pp. 135606-135620, 2019.
[https://doi.org/10.1109/ACCESS.2019.2941772]

-
Y. Dorogyy and V. Kolisnichenko, “Designing spiking neural networks”, IEEE TCSET, pp. 124-127, 2016.
[https://doi.org/10.1109/TCSET.2016.7451989]

-
H. Jang, O. Simeone, B. Gardner, and A. Gruning, “An Introduction to Spiking Neural Networks: Probabilistic Models, Learning Rules, and Applications”, IEEE Signal Processing Magazine, Vol. 36, No. 6, pp. 64-77, 2019.
[https://doi.org/10.1109/MSP.2019.2935234]

- W. Gerstner, W. M. Kistler, R. Naud, and L. Paninski, Neuronal Dynamics: From Single Neurons to Networks and Models of Cognition, Cambridge University Press, United Kingdom, 2014.
- https://www.hysionet.org, (retrieved on June 28, 2021).

