High Sensitivity and Selectivity of Array Gas Sensor through Glancing Angle Deposition Method
This is an Open Access article distributed under the terms of the Creative Commons Attribution Non-Commercial License(https://creativecommons.org/licenses/by-nc/3.0/) which permits unrestricted non-commercial use, distribution, and reproduction in any medium, provided the original work is properly cited.
Abstract
In this study, we propose an array-type gas sensor with high selectivity and response using multiple oxide semiconductors. The sensor array was composed of SnO2 and In2O3, and the detection characteristics were improved by using Pt, Au, and Pd catalysts. All samples were deposited directly on the Pt interdigitated electrode (IDE) through the e-beam evaporator glancing angle deposition (GAD) method. They grew in the form of well-aligned nanorods at off-axis angles. The prepared SnO2 and In2O3 nanorod samples were exposed to CH3COCH3, C7H8, and NO2 gases in a 300°C dry condition. Au-decorated SnO2, Au-decorated In2O3, and Pd-decorated In2O3 exhibited high selectivity for CH3COCH3, C7H8, and NO2, respectively. They demonstrated a high detection limit of the sub ppb level computationally. In addition, measurements from each sensor were executed in the 40% relative humidity condition. Although there was a slight reduction in detection response, high selectivity and distinguishable detection characteristics were confirmed
Keywords:
Gas sensors, Metal oxide semiconductors, Nanorod, SnO2, In2O31. INTRODUCTION
Exhaled human breath contains several different compounds, including a variety of volatile organic compounds (VOCs) [1,2]. The number of VOCs varies depending on the state of the human body. Expiration analysis is an important research field that has recently received tremendous interest due to the advancement of analysis technology and nanotechnology. Analysis of exhaled breath is a method that has been used for disease diagnosis since ancient times and was popular in the era of Hippocrates [3]. In general, highly sensitive gas sensors are a good option for the early diagnosis of diseases, such as lung cancer [4], diabetes [5], congestive heart failure [6], and asthma [7]. VOCs are mainly in the range of ppm–ppt (part per million to part per trillion); hence, laboratory methods such as GC–MS (gas chromatography–mass spectroscopy) [8] and PTR(proton-transfer-reaction) are used for exhaled human breath detection. However, the following methods are limited in their efficacy for disease diagnosis owing to disadvantages, such as high cost, bulkiness, high power consumption, and low performance.
However, a resistive sensor using a metal oxide semiconductor (MOS) displays advantages, such as low power consumption, low cost, scalable manufacturing, and excellent stability. In particular, a fast detection speed enables real-time monitoring [9-11]. In fact, numerous exhalation diagnostic sensors have been developed by applying various nanostructures, such as nanorods, thin films, nanotubes, and nanowires [12,13]. The nanostructure-based sensor exhibits excellent performance, such as high surface/ volume ratio, low defects, and simple integration of chip devices. However, these methods possess several limitations, such as multiple-step process and poor contact. In addition, exhaled human breath contains many kinds of VOCs; the problem of selectivity also needs to be solved. In the case where a single sample is used, limitations exist, such as classification of a specific gas and high selectivity.
In this study, we propose an array-type gas sensor using an oxide semiconductor. SnO2 and In2O3, which have been attracting attention for their high detection performance, were used as sensing materials. The sensing material was easily deposited on the SiO2 substrate in the form of nanorods through the e-beam evaporator GAD method. To improve detection performance and impart selectivity, Pt, Au, and Pd were deposited on the nanorod as catalysts. The fabricated sample was measured for CH3COCH3, C7H8, and NO2. High detection characteristics were confirmed at the sub ppb level.
2. EXPERIMENTAL
2.1 Fabrication process
Interdigitated electrodes (IDEs) were fabricated using Pt/Ti (150/30 nm), on a 4-inch SiO2/Si substrate through photolithography. The distances between each electrode were 5 μm and 20 electrodes were placed in an area measuring 1 mm × 1 mm. The Pt-IDEs patterned substrates were cleaned with acetone, ethanol, and deionized water, after which they were dried under a flow of nitrogen gas.
Subsequently, electron beam evaporation was performed to deposit the SnO2 and In2O3 nanorods at a glancing angle of 80o at a rotation speed of 15 rpm in off-axis mode. Shadow masks were used to deposit exclusively onto the area containing the electrodes, and the substrate was placed 30 cm from the crucible. The base pressure and growth rates were 5 × 10⁻⁶ mTorr and 1 Å s−1, respectively. During the nuclei growth, the self-shadowing effect occurred depending on the incident angle of vapor flux. Next, the Pt, Au, and Pd catalysts were deposited by performing evaporation at a glancing angle of 15o with a rotation speed of 15 rpm in offaxis mode. The base pressure and growth rates were 5 × 10⁻⁶ mTorr and 0.1 Å s−1, respectively. All the fabricated specimens were annealed at 550°C for 2 h in ambient air after the process of deposition.
2.2 Characterization and gas sensor measurements
The morphology of the fabricated SnO2 and In2O3 nanorods was observed using a field-emission scanning electron microscope (SEM) (Inspect F50) with an acceleration voltage of 15 kV and a working distance of 10 mm.
The gas sensing properties were measured by external heating of the quartz tube in a box furnace. The gas flow rate was maintained at 1000 sccm using mass flow controllers, and the gas flow was varied from dry air to a calibrated target gas. The resistances were measured at a DC bias voltage of 1 V using a source measurement unit (Keithley 2401), and all the measurements were recorded on a computer using LabVIEW with general purpose interface bus (GPIB).
3. RESULTS AND DISCUSSIONS
3.1 Fabrication of nanorods and catalysts
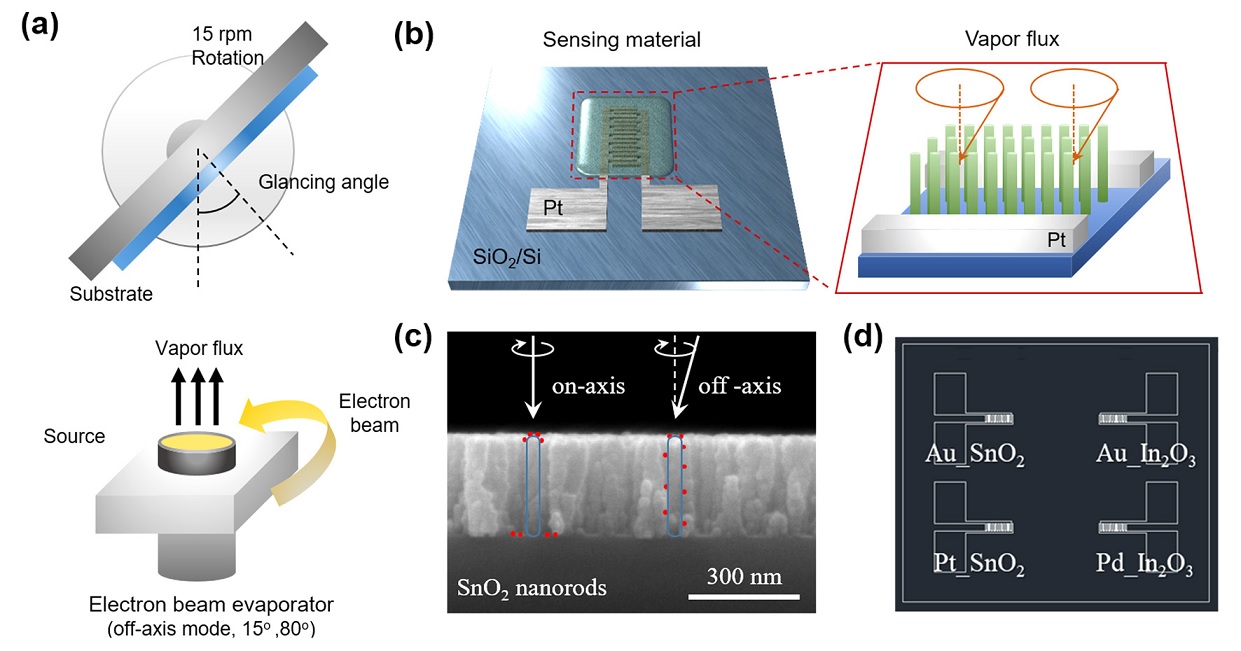
The sensing materials, SnO2 and In2O3, are deposited directly on the PT IDE using the e-beam evaporator GAD method (Fig. 1(a)). At this time, it is possible to form well-aligned nanorods without a separate process due to the shadowing effect generated by the high tilt angle. The shadowing effect must be taken into consideration when evaporation equipment, such as e-beam evaporator with excellent straightness, is used, and the deposition process occurs at a high angle. It is deposited in the form of inclined nanorods, which can form straight nanorods through substrate rotation. Next, the low-angle GAD method can also be used for Pt, Au, and Pd catalyst deposition (Fig. 1(d)). While using the existing on-axis method, the catalyst cannot be dispersed on the entire surface of the straight nanorods and can be concentrated only on the upper part of the nanorods. This problem can be solved by dispersing the catalyst from a low angle off-axis to the inside of the nanorods.

Schematic of (a) the fabrication procedures using GAD method via electron beam evaporation, (b) Nanorods deposited on Pt interdigitated electrode (IDE), and (c) catalyst decorated on nanorods using off-axis mode, (d) overall array gas sensor.
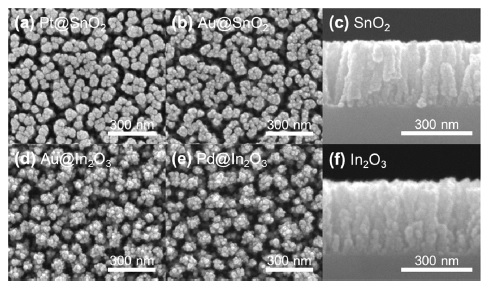
Figure 2 illustrates the top and cross-sectional SEM images of the well-aligned SnO2 and In2O3 nanorods according to the fabrication procedure. All samples deposited with the same length of 300 nm and the surface changes depending on the catalyst can be confirmed through the top image.
3.2 Gas sensing characteristics
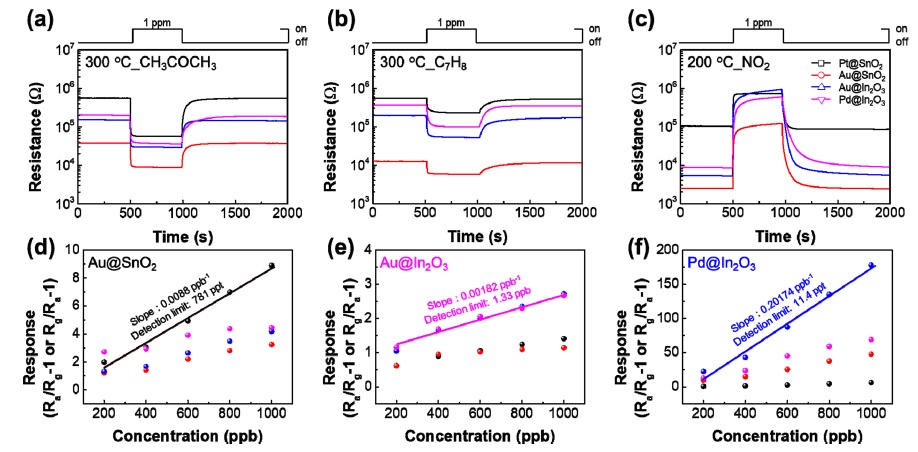
The gas-sensing properties of individual samples were investigated by exposing all samples to 1 ppm of CH3COCH3 at 300°C, C7H8 or NO2 at 200°C (Fig. 3(a)-(c)). The response is defined as (Rg/Ra − 1), where Ra and Rg denote the resistance of the sensors in the absence and presence of the target gas, respectively. Each sample exhibited different sensing properties depending on the decorated catalyst. In particular, Au-decorated SnO2 produced a response of 8.9 for 1 ppm CH3COCH3, Audecorated In2O3 displayed a response of 2.7 for 1 ppm C7H8, and a Pd-decorated In2O3 displayed a sensitivity of 178 for 1 ppm NO2.

(a–c) Real time response to 1 ppm CH3COCH3, C7H8 and NO2. (d–f) Sensor response as a function of gas concentration and theoretical detection of limits at 300°C or 200°C in dry atmosphere.
In addition, the gas detection characteristics were measured for various concentrations from 0.2–1 ppm (Fig. 3(d)-(f)) to measure the linearity and long-term stability of the sensor for each gas concentration. Through this, we confirmed through calculation that Au-decorated SnO2, Au-decorated In2O3, and Pd-decorated In2O3 have detection limits of 781 ppt, 1.33 ppb, and 11.4 ppb respectively for CH3COCH3, C7H8, and NO2.
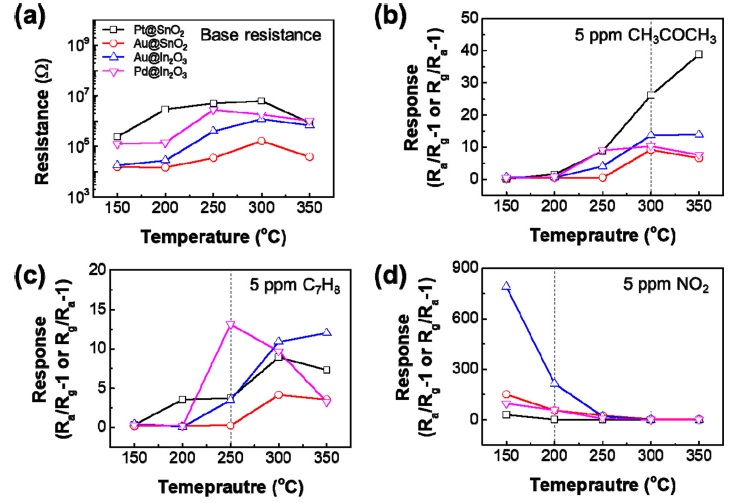
Humidity and measurement temperature are the factors that significantly influence the sensing characteristics of a sensor. To investigate the gas detection characteristics based on the moisture and temperature, we measured 5 ppm CH3COCH3, C7H8, and NO2, at various temperatures ranging from 150-350 °C at 40% relative humidity (Fig. 4). It was confirmed that the sensor sensitivity had high selectivity for a specific temperature and gas, and the sensitivity was slightly reduced compared to that in a dry environment, but it still had high selectivity and distinguishable sensitivity.
3.3 Gas sensing mechanism
Oxygen adsorbed on the surface of the oxide semiconductor from the surrounding air forms a depletion layer and increases the resistance (Fig. 5(a)). When a catalyst is used, the catalyst is distributed over the entire surface of the semiconductor to move the electrons from the semiconductor to the catalyst, thereby promoting the formation of a depletion layer of the semiconductor and further increasing the resistance (Fig. 5(b)). At this time, oxygen species are adsorbed on the metal oxide surface in the form of O2-, O-, or O2- depending on the temperature. Afterwards, the reducing gases, CH3COCH3 and C7H8, react with oxygen on the surface of the semiconductor and cause the following changes:
| (1) |
| (2) |
This leads to desorbing oxygen on the surface of the semiconductor and reducing the resistance (Fig. 5(c)). In contrast, in the process wherein NO2 is adsorbed on the semiconductor surface in the same way as oxygen, electrons are extracted from the semiconductor surface, forming a depletion layer and increasing the resistance (Fig. 5(d)). In the case of NO2, the adsorbed oxygen has a higher reactivity at low temperatures because the adsorbed oxygen limits the space in which NO2 is adsorbed.
4. CONCLUSIONS
To solve the existing low selectivity problem, we simultaneously observed the sensing characteristics of various sensors in the form of an array. We deposited SnO2 and In2O3 in the form of nanostructures directly on the IDE without a separate process through the e-beam evaporator GAD method. At this time, Pt, Au, and Pd were used as catalysts to enhance the sensing characteristics. The prepared samples displayed high detection characteristics of sub ppb level for CH3COCH3, C7H8, and NO2 gases in a dry environment. It was confirmed that these high detection characteristics can be distinguished even in a humid condition. In addition, the selective reaction between gases, which is difficult to distinguish when using a single sample, was also supplemented by using multiple sensors. This study highlights the advantages of fabricating one-chip array sensors, and we are confident that using an array that integrates a greater number of sensors can provide high selectivity.
Acknowledgments
This work was supported by an Institute for Information & Communications Technology Promotion (IITP) grant funded by the Korean government (MSIP; Ministry of Science, ICT & Future Planning; No. 2019-0-00725, Development of Non-contact Dementia Screening and Cognitive Enhancer Content Technology)
References
-
B. de Lacy Costello, A. Amann, H. Al-Kateb, C. Flynn, W. Filipiak, T. Khalid, D. Osborne, and N. M. Ratcli, “A review of the volatiles from the healthy human body”, J. Breath Res., Vol. 8, No. 1, pp. 014001 (29pp), 2014.
[https://doi.org/10.1088/1752-7155/8/1/014001]

-
Phillips, M.; Byrnes, R.; Cataneo, R.N.; Chaturvedi, A.; Kaplan, P.D.; Libardoni, M.; Mehta, V.; Mundada, M.; Patel1, U.; Ramakrishna, N.; “Detection of volatile biomarkers of therapeutic radiation in breath”, J. Breath Res., Vol. 7, No. 3, pp. 0360002 (8pp), 2013.
[https://doi.org/10.1088/1752-7155/7/3/036002]

- A. G. Dent, T. G. Sutedja, and P. V. Zimmerman, “Exhaled breath analysis for lung cancer”, J. Thoracic Dis., Vol. 5, pp. S540(1)-S550(11), 2013.
-
A. Bajtarevic, C. Ager, M. Pienz, M. Klieber, K. Schwarz, M. Ligor, T. Ligor, W. Filipiak, H. Denz, M. Fiegl, W. Hilbe, W. Weiss, P. Lukas, H. Jamnig, M. Hackl, A. Haidenberger, B. Buszewski, W. Miekisch, A. Amann, “Noninvasive detection of lung cancer by analysis of exhaled breath”, BMC Cancer, Vol. 9, pp. 348(1)-348(16), 2009.
[https://doi.org/10.1186/1471-2407-9-348]

-
O. E. Owen, V. E. Trapp, C. L. Skutches, M. A. Mozzoli, R. D. Hoeldtke, G. Boden, “Acetone metabolism during diabetic ketoacidosis”, Diabetes, Vol. 31, No. 3, pp. 242-248, 1982.
[https://doi.org/10.2337/diab.31.3.242]

-
M. Kupari, J. Lommi, M. Ventilä, and U. Karjalainen, “Breath acetone in congestiveheart failure”, Am. J. Cardiol., Vol. 76 No. 14, pp. 1076-1078, 1995.
[https://doi.org/10.1016/S0002-9149(99)80304-X]

-
S. S. Sehnert, L. Jiang, J. F. Burdick, and T. H. Risby, “Breath biomarkers for detectionof human liver diseases: preliminary study”, Biomarkers, Vol. 7, pp. 174-187, 2002.
[https://doi.org/10.1080/13547500110118184]

-
G. Lubes and M. Goodarzi, “GC-MS based metabolomics used for the identification of cancer volatile organic compounds as biomarkers”, J. Phar. Biomed. Anal., Vol., 147, pp. 313-322, 2018.
[https://doi.org/10.1016/j.jpba.2017.07.013]

-
Y. Hu, J. Lei, Z. Wang, S. Yang, X. Luo, G. Zhang, “Rapid response hydrogensensor based on nanoporous Pd thin films”, Int. J. Hydrog. Energy, Vol. 41, No. 25, pp. 10986- 10990, 2016.
[https://doi.org/10.1016/j.ijhydene.2016.04.101]

-
N. Brsan and U. Weimar, “Understanding the fundamental principles of metal oxide based gas sensors; the example of CO sensing with SnO2 sensors in the presence of humidity”, J. Phys. Condens. Matter., Vol. 15, No. 20, pp. R813-R839, 2003.
[https://doi.org/10.1088/0953-8984/15/20/201]

-
S. D. Han, Y. G. Song, Y. S. Shim1, H. R. Lee, S. J. Yoon, and C. Y. Kang” Preparation of Nanocolumnar In2O3 Thin Films for Highly Sensitive Acetone Gas Sensor”, Preparation of Nanocolumnar In2O3 Thin Films for Highly Sensitive Acetone Gas Sensor, Vol. 25, No. 6 (2016) pp. 383- 387
[https://doi.org/10.5369/JSST.2016.25.6.383]

- S. Y. Yi, Y. G. Song, G. S. Kim, C. Y. Kang, “ In-decorated NiO Nanoigloos Gas Sensor with Morphological Evolution for Ethanol Sensors”, JSST, Vol. 28, No. 4, pp.231-235
-
H.-S. Woo, C. W. Na, I.-D. Kim, and J.-H. Lee, “Highly sensitive and selective trimethylamine sensor using one-dimensional ZnO-Cr2O3 hetero-nanostructures”, Nanotechnology, Vol. 23, No. 24, pp. 245501(1)-245501(10).
[https://doi.org/10.1088/0957-4484/23/24/245501]


